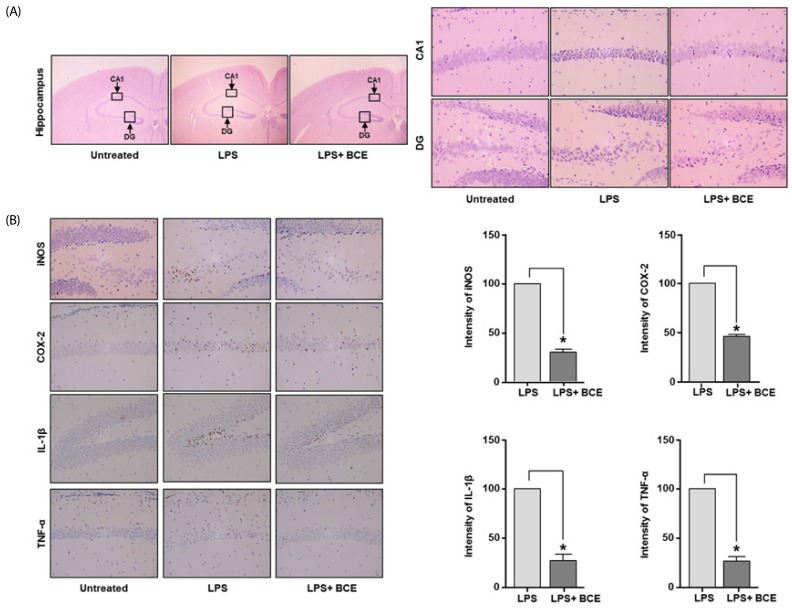
Fig. 3. Effects of black chokeberry extract on lipopolysaccharide-induced neuroinflammation.
Representative photomicrographs of mouse brain cross-sections taken 7 days after an intraperitoneal injection of LPS. (A) Analysis of hippocampus morphology using hematoxylin and eosin staining. (B) Immunohistochemical staining for inducible nitric oxide synthase (iNOS), cyclooxygenase 2 (COX-2), interleukin-1β (IL-1β), and tumor necrosis factor α (TNF-α) was performed in the cross-sections. Shading represents the intensity of brown color from iNOS, COX-2, IL-1β and TNF-α expression in the analyzed groups. Protein expression in the LPS group was considered to be 100%. Data are expressed as mean ± SD (n = 3). *Significant difference when compared to the LPS group (P < 0.05). BCE, black chokeberry extract; LPS, lipopolysaccharide; DG, dentate gyrus; CA1, cornu amonis 1; iNOS, inducible nitric oxide synthase; COX-2, cyclooxygenase 2; IL-1β, interleukin 1 beta; TNF-α, tumor necrosis factor alpha.

