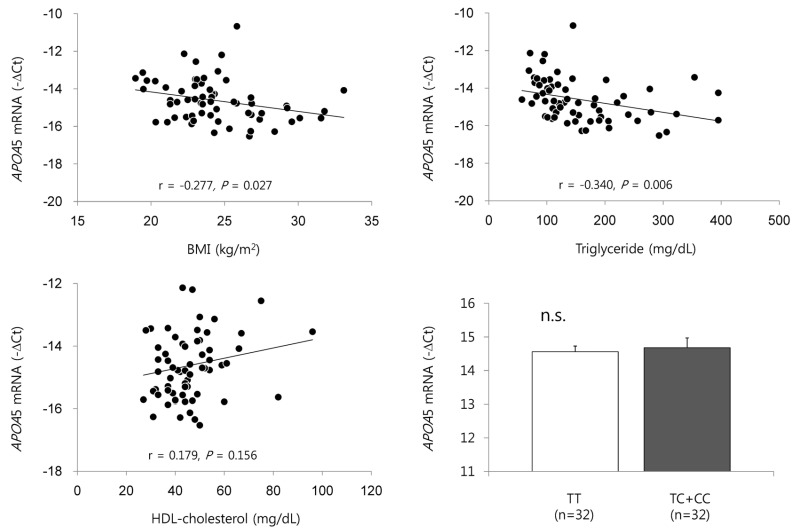
Fig. 1. Relationships between APOA5 mRNA expression and body mass index, circulating triglyceride, and high-density lipoprotein cholesterol levels and/or mRNA abundance of APOA5 according to the APOA5 rs662799 genotype.
Results are expressed as r (correlation coefficient) or mean ± SE tested by Pearson's correlation analysis or independent t-test (non-parametric test); n.s. indicates no statistically significant differences in the values among the groups.

