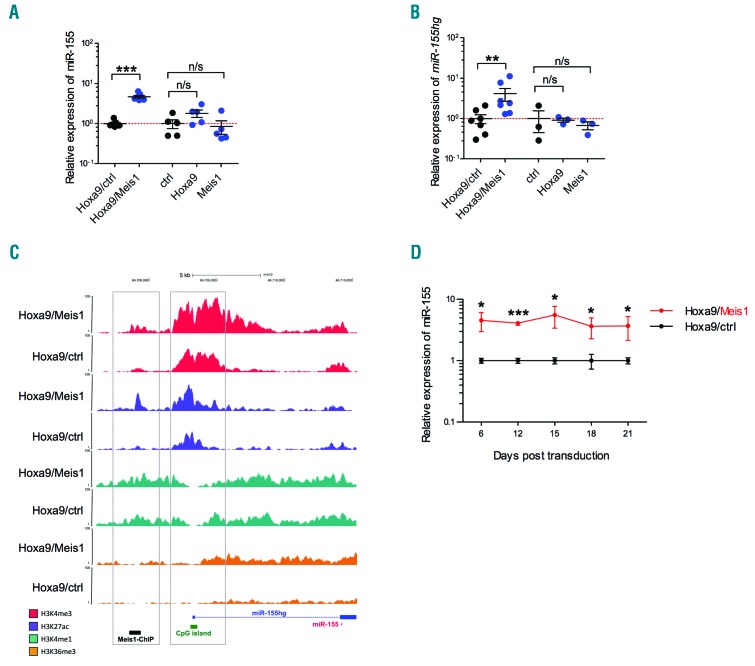
Figure 1.
MiR-155 and its host gene, miR-155hg, are significantly upregulated in leukemic Hoxa9/Meis1 cells. (A) Relative expression of miR-155 in BM cells independently transduced with Hoxa9/Meis1 (n=7), Hoxa9 (n=5) or Meis1 (n=5) quantified by RT-qPCR and expressed relative to cells transduced with Hoxa9/ctrl (n=7) or an empty control vector (ctrl) (n=5), respectively. (B) Expression of miR-155hg in BM cells independently transduced with Hoxa9/Meis1 (n=7), Hoxa9 (n=3) or Meis1 (n=3) relative to expression in cells transduced with Hoxa9/ctrl (n=7) or an empty control (ctrl) (n=3), respectively. (C) ChIP-sequencing tracks for H3K4me3, H3K27ac, H3K4me1 and H3K36me3 in Hoxa9/Meis1 and Hoxa9/ctrl cells at the Meis1 binding site and miR-155hg locus are shown mapped to the mouse mm10 genome browser. Location of Meis1 binding site identified by Meis1 ChIP-sequencing is shown with a black bar. The black arrow depicts the transcriptional direction of miR-155hg. Open boxes indicate the region of the Meis1 binding site and the 5′region of the miR-155hg. (D) The kinetics of miR-155 expression measured by RT-qPCR over time in n=3 biological replicates of Hoxa9/Meis1 transduced cells relative to Hoxa9/ctrl cells. Statistical significance was calculated using the Student’s t-test (two-tailed). See also Online Supplementary Tables S5–S7.

