Figure 3.
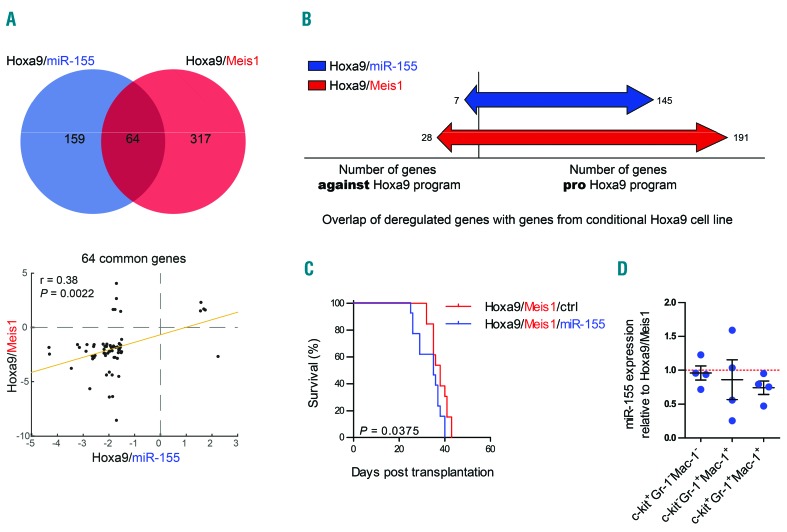
Hoxa9/miR-155 and Hoxa9/Meis1 cells display a similar gene expression pattern. (A) Upper panel shows overlap of differentially expressed genes in Hoxa9/miR-155 and Hoxa9/Meis1 cells. The fold change of differentially expressed genes was calculated relative to Hoxa9/ctrl cells. The scatter plot below shows the fold change of common genes between Hoxa9/Meis1 and Hoxa9/miR-155. The significance and correlation coefficient (r) was calculated using Pearson’s correlation coefficient. (B) Overlap between gene expression profile of Hoxa9/miR-155 and Hoxa9/Meis1 cells with the Hoxa9-mediated gene expression dataset from a conditional Hoxa9 cell line (Huang et al).34 (C) Survival curves of mice transplanted with two biological replicates of Hoxa9/Meis1/ctrl or Hoxa9/Meis1/miR 155 cells (n=13/arm). (D) MiR-155 expression levels in the depicted sorted subpopulations of Hoxa9/Meis1 cells shown relative to expression in Hoxa9/Meis1 bulk cells. For each subpopulation n=4 biological replicates were analyzed, except for the c-kit Gr 1+Mac 1+ subpopulation, where only four replicates were available. See also Online Supplementary Figure S3, Online Supplementary Table S4 and Online Supplementary Table S5.

