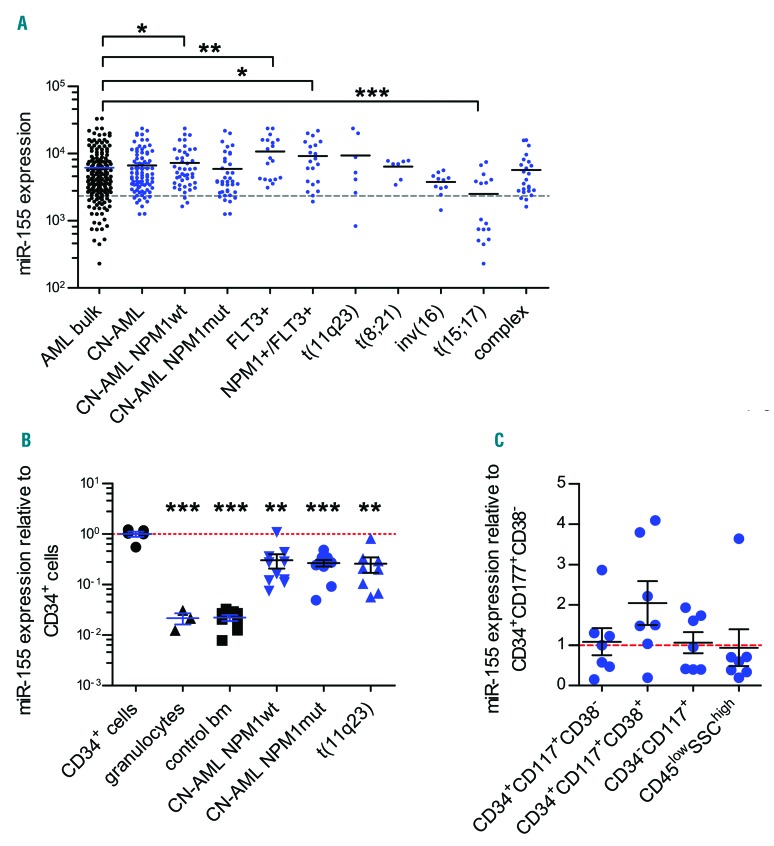
Figure 5.
MiR-155 expression is elevated in CD34+ cord blood cells but shows no difference between AML subpopulations. (A) MiR-155 expression levels across various genetic AML subgroups (n=187) from the LAML-TCGA dataset. The gray dashes indicate the global mean of all miRNAs for each sample. (B) MiR-155 expression levels in CN-AML NPM1wt (n=10), CN-AML NPM1mut (n=10) and t(11q23) (n=8) AML patient samples as well as sorted granulocytes (n=4) and total BM from healthy donors (n=8), measured by RT-qPCR and compared to CD34+ cord blood cells (n=5). (C) Relative expression levels of miR-155 in sorted subpopulations of AML patient samples (n=7) shown relative to expression in the CD34+CD117+CD38− subpopulation. See also Online Supplementary Figure S5. AML: acute myeloid leukemia; miR: Micro-ribonucleic acid; CN-AML: cytogenetically normal

