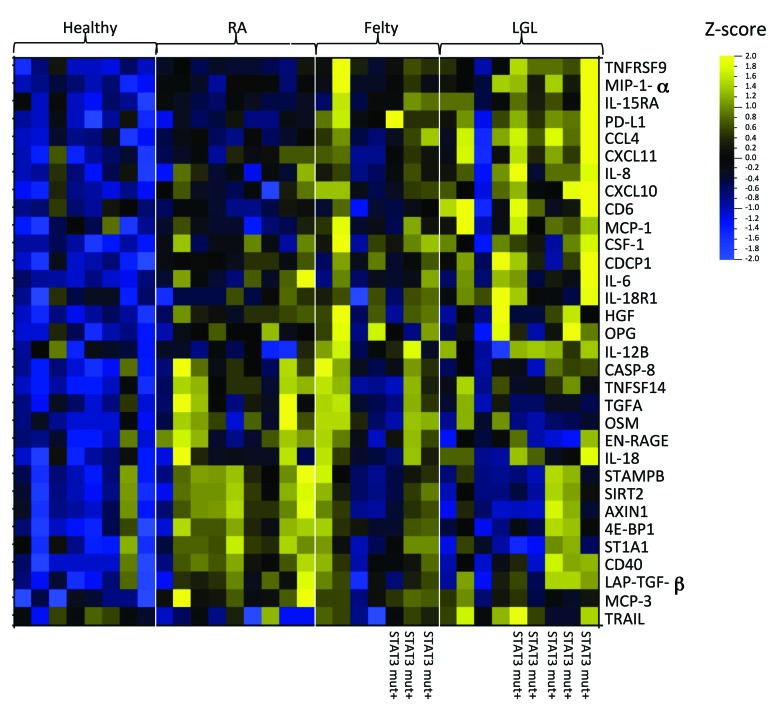
Figure 4.
Felty syndrome patients have a similar cytokine profile as that of LGL leukemia. The heatmap compares the plasma cytokine profiles of healthy controls, RA patients, Felty syndrome patients, and LGL leukemia patients. Data was analyzed as NPX units, and were normalized to allow for coloring on the same scale for the heatmap. Bright blue represents smaller protein concentration, while bright yellow represents higher protein concentration. The heatmap shows all cytokines for which the Q-value (false discovery rate) was less than 0.1. RA: rheumatoid arthritis; LGL: large granular lymphocyte.

