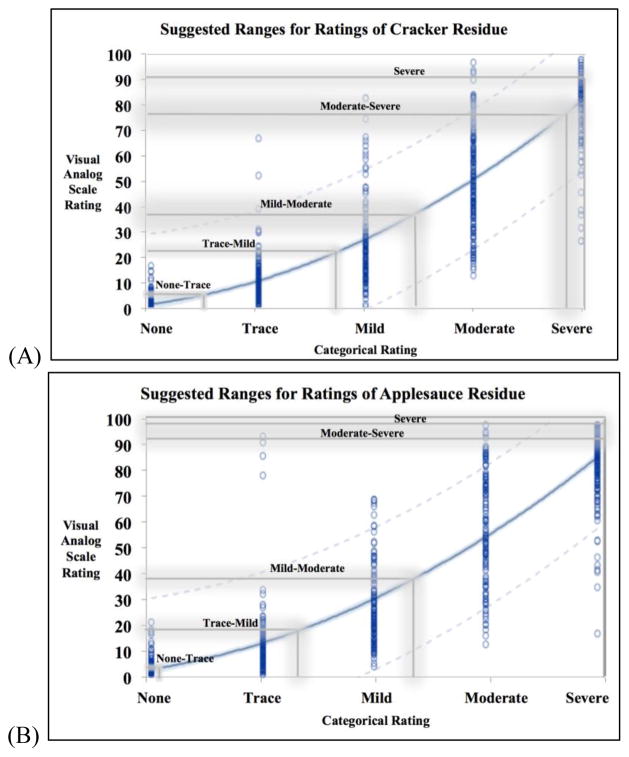
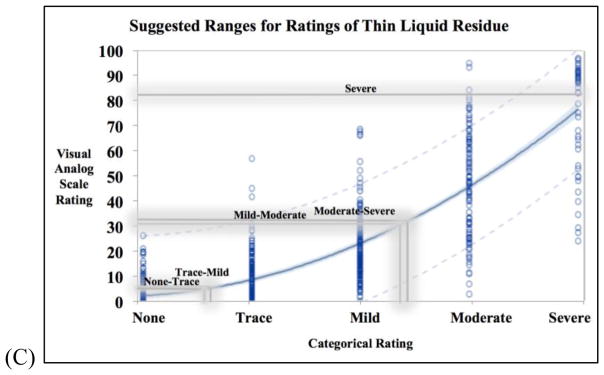
Figure 3.
Three curvilinear models for (A) cracker (n=825), (B) applesauce (n=824), (C) thin liquid (n=824) residue ratings to represent the relationship between each visual analog scale (VAS) rating and its counterpart on the ordinal rating scale. Each blue circle is a data point and the 95% confidence limits of the model is indicated by the tight light blue shading along the regressions line. The grey lines are the upper thresholds of 1 standard deviation from all clinician ratings of that cluster of videos.


