Table 2.
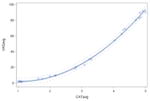
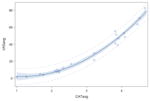
Linear versus quadratic modeling of ordinal and visual analog scale ratings of residue as described by Stevens (1975).
| Bolus Type | Equation (p-value) | r2 | Figure | |
|---|---|---|---|---|
| Linear Modeling | Thin Liquid | y= −22.64 + 17.48x p<0.0001 |
0.85 |
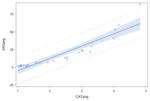
|
| Applesauce | y= −32.51 + 22.97x p<0.0001 |
0.93 |
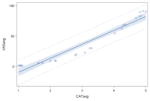
|
|
| Cracker | y= −32.35 + 21.11x p<0.0001 |
0.91 |
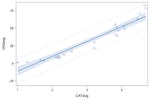
|
|
| Quadratic Modeling† | Thin Liquid | y= 14.32 −17.80x + 6.73x2 p<0.0001 |
0.98* |
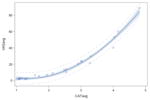
|
| Applesauce | y= 8.32 −12.33x + 5.88x2 p<0.0001 |
0.99* |
|
|
| Cracker | y= 10.20 −13.94x + 6.03x2 p<0.0001 |
0.98* |
|
Significantly different than respective r2 values of the same bolus type’s linear model r2 value (p<0.0001).
The equations listed here were done on transformed data in accordance with the described psychometric testing. The descriptive text lists other quadratic equations that can be used without transforming data.
