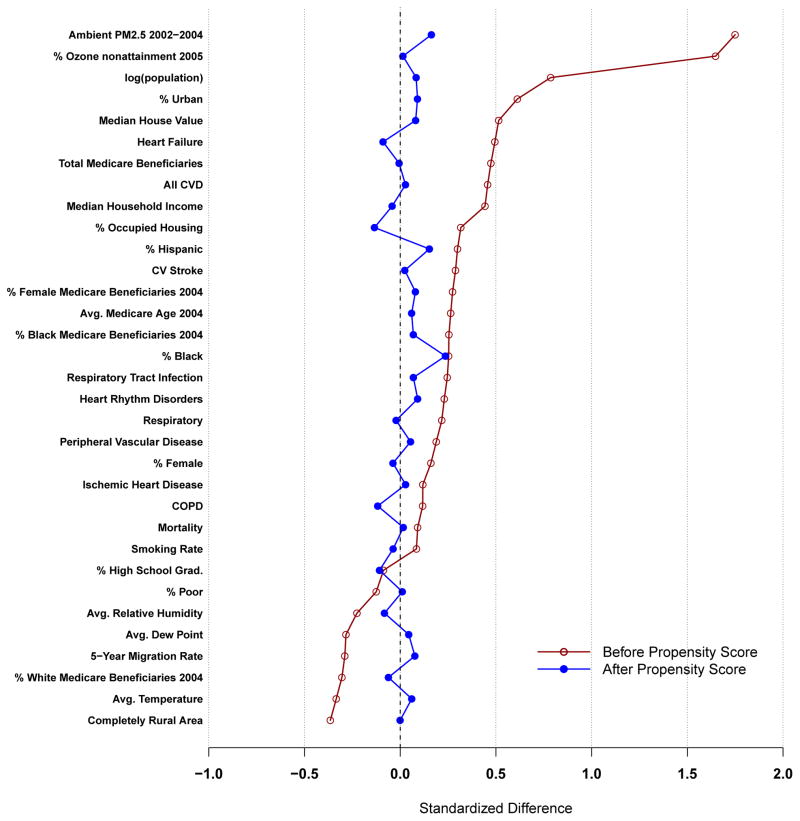
Figure 3.
Plots of average standardized mean difference in each measured covariate between attainment and nonattainment locations. Red line denotes differences before propensity score pruning and subclassification, blue line denotes differences within propensity score subclass. Values closer to zero represent covariate balance between attainment and nonattainment areas. CV(D) is cardiovascular (disease). COPD is chronic obstructive pulmonary disease.

