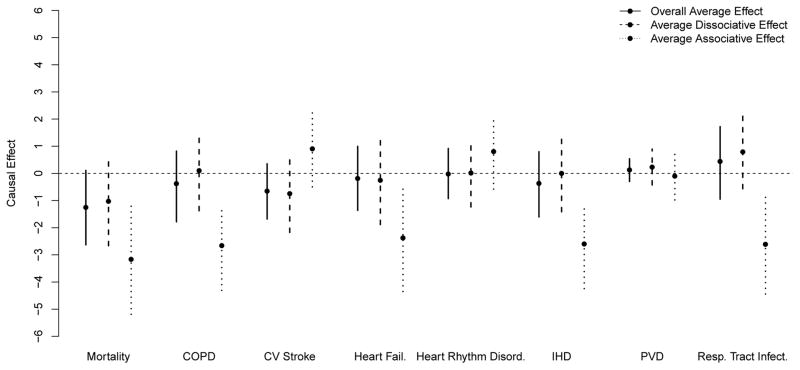
Figure 4.
Posterior mean point estimates and 95% posterior probability intervals for overall, associative, and dissociative effects in the analysis of PM2.5 nonattainment designations. Effects are measured as risk differences. Overall average effects are calculated across all 183 nonattainment locations. Dissociative effects are averaged across locations where PM2.5 is estimated to have changed less than 1 μg/m3. Associative effects are averaged across locations where PM2.5 is estimated to have been reduced by at least 1 μg/m3.

