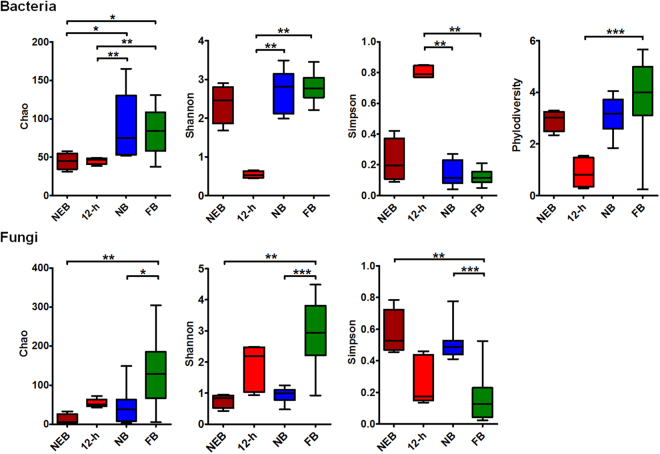
Figure 1.
Comparison of alpha-diversity indices of the gut microbial community in honey bees performing four social roles. Box plots depict the medians (central horizontal lines), inter-quartile ranges (boxes), and 95% confidence intervals (whiskers). NEB, newly-emerged bee; 12-h, 12-h-old bee; NB, nurse bee; FB, foraging bee. An FDR adjusted p-value are from Kruskal-Wallis test. Asterisks indicate statistically significant differences between pairs of values (*P < 0.05, **P < 0.01, ***P < 0.001, and ****P < 0.0001).

