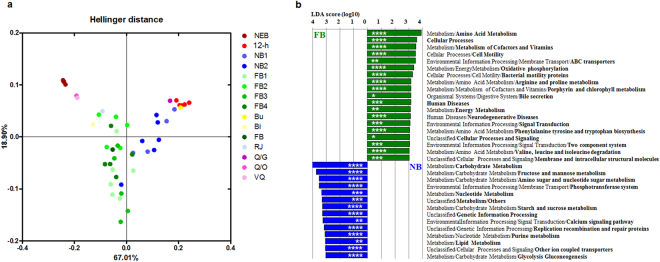
Figure 4.
Comparison of the predictive functions of bacterial communities using 16S rRNA marker gene sequences. (a) PCA representing changes in the total gene family at the KEGG level 3 of bacterial communities, according to the honey bee social roles. (b) Comparison of the profiles of differentially enriched genes between the nurse bee and foraging bee. The threshold of the LDA score was 3.0. NEB, newly-emerged bee; 12-h, 12-h-old bee; NB, nurse bee; FB, foraging bee. P-values are carried out with unpaired t-test with Welch’s correction. Asterisks indicate statistically significant differences between the pairs of values (*P < 0.05, **P < 0.01, ***P < 0.001, and ****P < 0.0001).

