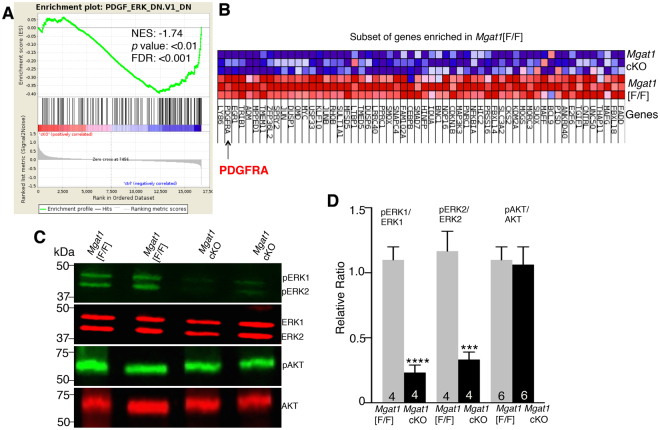
Figure 6.
Signaling pathways in Mgat1 cKO germ cells at 22 dpp. (A) GSEA analysis showing enrichment of a PDGF_ERK signature in control germ cells. (B) Heat map shows the cluster of DEGs in the PDGF_ERK signaling pathway positively-enriched in control versus Mgat1 cKO germ cells. Arrow identifies PDGFRA as down-regulated in Mgat1 cKO germ cells. (C) Western blot analysis of phosphorylated and unphosphorylated ERK1, ERK2 and AKT in germ cells of Mgat1 cKO compared to control. The gels from which these data were obtained are shown in Supplementary Fig. S7. (D) Histogram of 2–3 independent experiments analyzed in 4–6 gels is shown (mean ± SEM; ***p < 0.005, ****p < 0.001).

