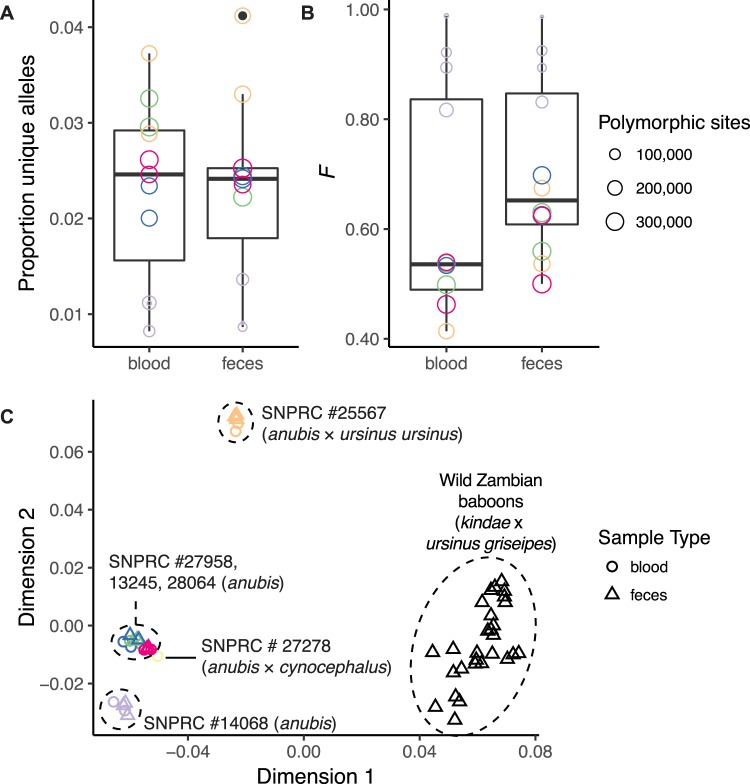
Figure 3.
Concordance between blood- and feces-derived genotyping data from the same individuals. Colors symbolize the six captive individuals included in our study. Within these individuals, we did not find significant differences in (A) the proportion of unique alleles or (B) inbreeding coefficients from blood- and feces-derived libraries. The multidimensional scaling plot of identity-by-state shows (C) population structuring concordant with the known ancestry of animals (Supplemental Table S1). Distances between feces- and blood-derived sets of genotypes from the same individual are minimal, indicating that noise added by the enrichment method is dwarfed by the population structure signal in this baboon population dataset.

