Figure 5.
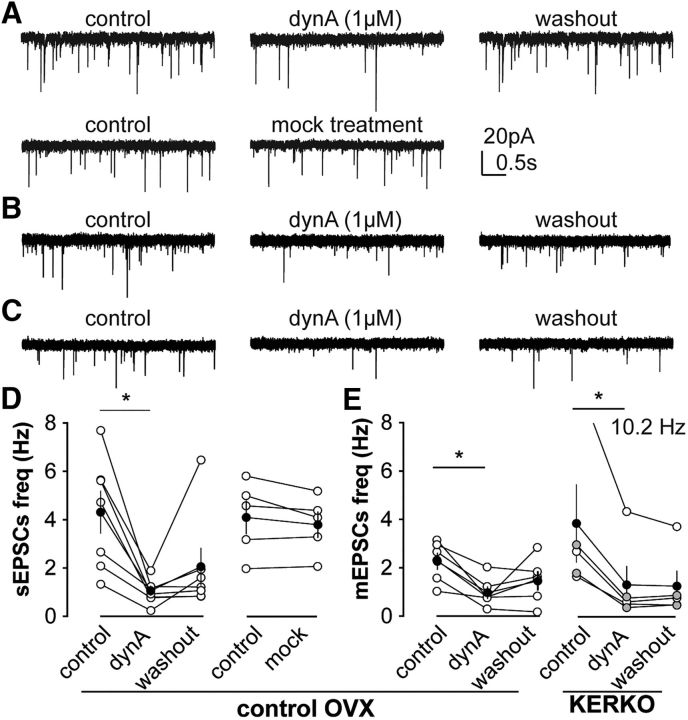
Dynorphin suppresses both sEPSC and mEPSCs frequency in arcuate kisspeptin neurons. A, representative sEPSCs in arcuate kisspeptin neurons in OVX mice during control, dynA treatment and washout period (upper) and during control and mock treatment (lower). B and C, representative mEPSCs during control, dynA treatment and washout period in arcuate kisspeptin neurons in OVX control mice (B) and in OVX KERKO mice (C). D, Individual values (white) and mean ± SEM (black) and sEPSC frequency in arcuate during control, treatment and washout (left) and during control and mock treatment (right). One data point that was out of range of the axes is indicated in text (10.2Hz). For dynA treatment (left), Friedman statistic = 8.9; for mock treatment (right), t statistic = 1.5, degrees of freedom (df) = 4. E, Individual values (white OVX, grey OVX+E) and mean ± SEM (black) mEPSC frequency during control, treatment and washout in OVX control mice (left, one-way ANOVA, treatment, F(2,10) = 4.9; individual, F(5,10) = 1.5) and in KERKO mice (right, Friedman statistic, 7.6). *p < 0.05.

