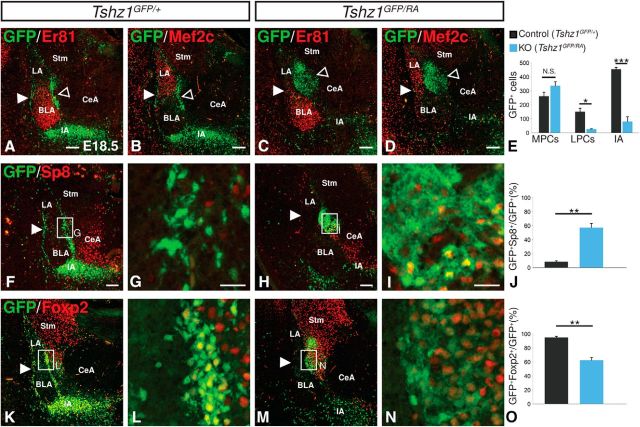
Figure 4.
Disrupted localization and gene expression in Tshz1 mutant ITCs. A, B, GFP+ ITCs are concentrated in the IA and distributed as clusters along the entire extent of the lateral (solid arrowheads) and medial (open arrowheads) borders of the BLA marked by Er81 (A) and LA marked by Mef2c (B) of control embryos (Tshz1GFP/+). C, D, Tshz1 mutants (Tshz1GFP/RA) display a large cluster (open arrowheads) of cells lying dorsal to the BLA (C) and medial to the LA (D), a striking reduction in IA density, and a nearly complete absence of lateral ITCs (solid arrowheads). E, Quantification of ITC numbers in Tshz1 controls (n = 3) and mutants (n = 3). F–I, Mutant ITCs (H, I) show increased Sp8 expression compared with controls (F, G). J, Quantification of the percentage of total GFP+ cells in the amygdala that also coexpress Sp8 (n = 3 for controls and mutants). K–N, Mutant ITCs (M, N) show reduced Foxp2 expression compared with heterozygous controls (M, N). O, Quantification of the percentage of total GFP+ cells in the amygdala that also coexpress Foxp2 (n = 3 for controls and mutants). LPCs, Lateral paracapsular clusters; MPCs, medial paracapsular clusters; Stm, striatum. Quantifications are displayed as mean ± SEM. *p ≤ 0.05, **p ≤ 0.01, ***p ≤ 0.001. Scale bars: A–D, F, G, K, M, 100 μm; G, I, L, N, 20 μm.

