Figure 3.
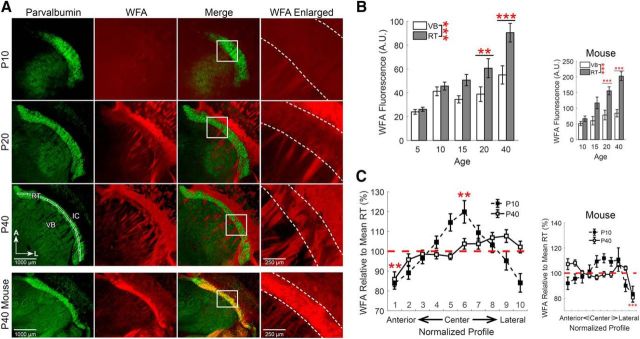
CSPGs are elevated around RT neurons. A, Immunofluorescence of parvalbumin (green) and labeling of CSPGs with WFA (red) in horizontal sections of rat thalamus at different developmental time points. All images are oriented with the anterior (A) aspect of the thalamus toward the top, the lateral (L) aspect toward the right. Dotted lines indicate the boundaries of the RT nucleus in the enlarged images. B, WFA staining increased across the ages we tested and was consistently elevated in the RT nucleus, relative to VB. C, Intensity of WFA labeling was measured in an ROI, subdivided into 10 segments, that extended from the anterior to the lateral extent of the RT nucleus (A, bottom left, Fig. 1C) and values were normalized to the mean intensity across this entire span. WFA labeling showed slight regional variability in both P10 and P40 rats. A similar pattern of WFA labeling was observed in mice. **p < 0.01, ***p < 0.001.

