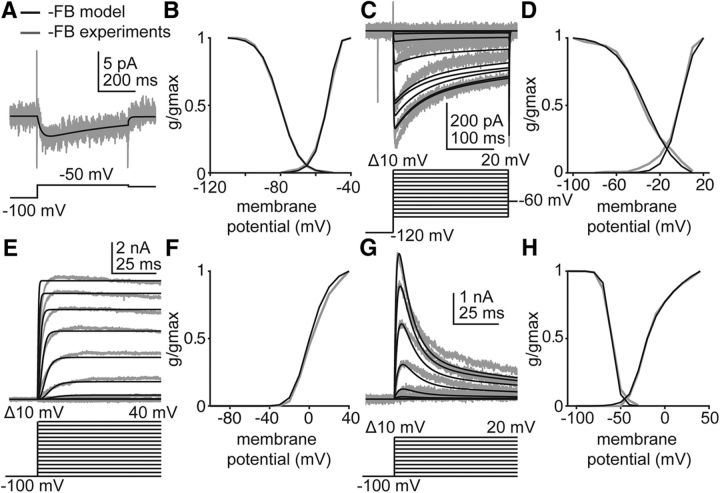
Figure 6.
The GnRH neuron model reproduces IA, IK, IHVA, and ILVA isolated in voltage-clamp experiments performed during negative feedback. Empirical data (gray) and model-simulated current (black) used in Hodgkin-Huxley modeling. Voltage protocols are located beneath the current responses in A, C, E, and G. Only those voltage steps used to estimate parameters for the simulated data are shown. A, ILVA in response to a depolarizing voltage step in OVXE+ AM mice. Empirical data from Sun et al. (2010). B, Simulated and empirical ILVA activation and inactivation curves from OVX+E mice during negative feedback. Empirical data from Zhang et al. (2009). C, Simulated and empirical IHVA in response to depolarizing voltage steps (below current response) during negative feedback. Empirical data from Sun et al. (2010). D, Simulated and empirical IHVA activation and inactivation curves determined from voltage-clamp experiments. Empirical data from Sun et al. (2010). E, Simulated and empirical IK in response to depolarizing voltage steps during negative feedback. F, Simulated and empirical activation curves for IK during negative feedback, determined from activation protocol in E. G, Simulated and empirical IA during depolarizing voltage steps during negative feedback. H, Simulated and empirical activation and inactivation curves for IA during negative feedback. Values from these fits populate Table 1, gvc.

