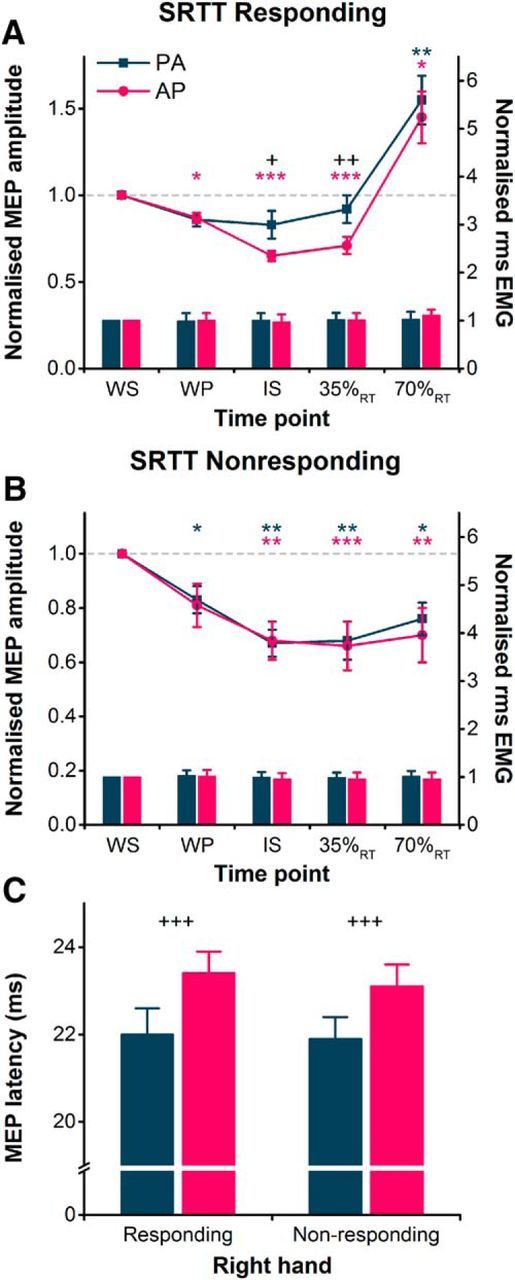
Figure 4.

A, During the simple reaction time task, MEP amplitudes in the right FDI shown normalized to the WS time point (colored lines, left y-axis) and were suppressed more for AP currents than for PA currents at the IS and 35%RT during right hand-responding blocks. The facilitation of MEPs in the same block at 70%RT was similar for both current directions. B, However, for right-hand nonresponding blocks, normalized MEP amplitudes were suppressed to a similar extent for AP and PA currents at all times following the WS. Voluntary rms EMG (colored bars, right y-axis) measured before the TMS pulse is shown normalized to values at the WS, and was similar for PA and AP currents across different time points for right hand-responding (A) and nonresponding (B) blocks. C, MEP latencies measured at the WS were longer for AP currents compared with PA currents in both right hand-responding and nonresponding blocks. *p < 0.05, **p < 0.01, ***p < 0.001, compared with WS time point within each current direction; +p < 0.05, ++p < 0.01, +++p < 0.001, AP vs PA.
