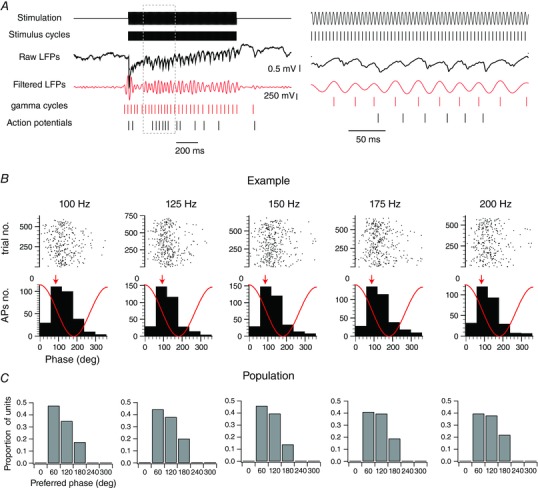
Figure 5. Gamma phase modulation of the spiking activity.

A, left: an example of single‐trial evoked responses of a single‐unit activity recorded alongside with local field potentials during vibrotactile stimulations of the PW at 200 Hz. The upper trace corresponds to the stimulus waveform. The second line corresponds to the stimulus cycles. They were extracted by detecting the peaks of the stimulus waveforms. The third trace corresponds to the raw local field potentials. The fourth trace corresponds to the band‐pass filtered (20–60 Hz) local field potentials. The gamma cycles (fifth trace) were detected by applying a threshold of 2.5 SD above the noise to the gamma peaks on the local field potentials after a band‐pass filtering of 20–60 Hz. The last trace corresponds to the spiking activity of the single unit. The right panel corresponds to an expended portion of the traces on the left. B, raster plot and histogram representations of the spike count distribution within the gamma cycles as a function of the stimulation frequency for an example unit. Red traces illustrate the idealized waveform of the filtered local field potential. The preferred phase is indicated by a red arrow. C, distributions of the preferred phase within the gamma cycles of individual units as a function of the stimulation frequency (n = 63 from 26 animals).
