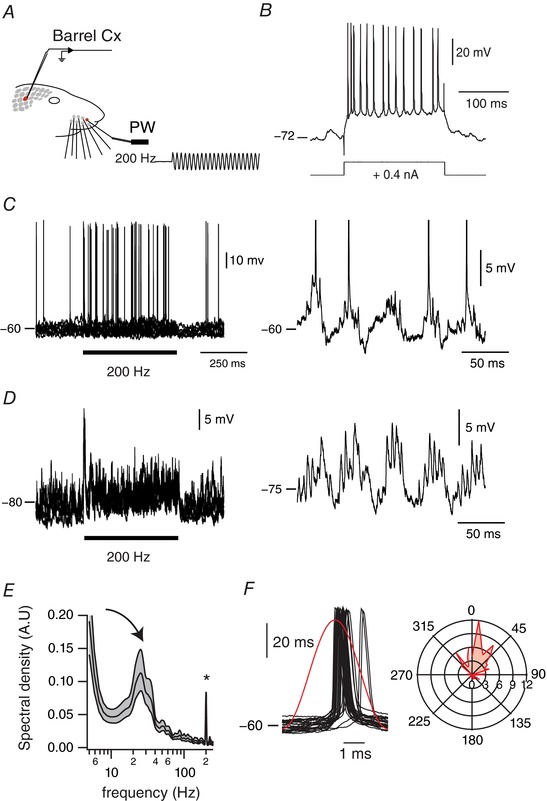
Figure 7. Sub‐threshold membrane potential fluctuations underlying coexisting temporal coding schemes.

A, schema of the experimental protocol. Recordings were made in S1 cortex while stimulating the PW using a piezo‐electric device. The trace represents a cutout of the onset of a vibrotactile stimulus waveform at 200 Hz, as measured with photodiodes. B, adapting firing pattern of a regular spiking cortical cell in response to a current pulse, at rates below 100 Hz. C, left panel, overlay of membrane potential fluctuations in response to a 200 Hz sinusoidal whisker stimulation at depolarized membrane potentials (10 trials). Horizontal bar indicates stimulus presentation. An expanded example of the sensory‐evoked activity is shown in the right panel. D, left panel, overlay of membrane potential fluctuations in response to a 200 Hz sinusoidal whisker stimulation when the cell was under enough hyperpolarizing current to preclude supra‐threshold responses (10 trials). Horizontal bar indicates stimulus presentation. Again, an expanded example of the sensory‐evoked activity is shown on the right panel. E, averaged power spectra of the sensory‐evoked membrane potential fluctuation when the cell was held at hyperpolarized membrane potentials. The analysis was computed between 50 and 450 ms after the onset of the stimulus presentation. Shaded regions indicate the 95% error bars estimated with a jackknife across tapers and trials. Asterisk indicates the frequency of stimulation; curved arrow indicates the emergent gamma band. F, left panel: overlay of action potentials of the cell with respect to the stimulus cycle. Red trace illustrates the stimulus waveform. Right panel: polar plot representation of the phase relationships between all the action potentials of the cell and the stimulus cycles (50 bins). Peak location of the stimulus cycle is indicated by 0 deg.
