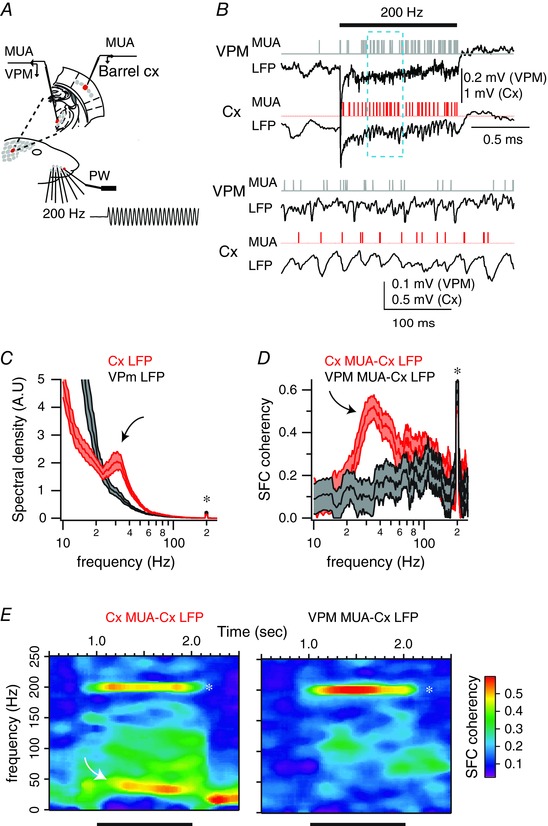
Figure 8. Lack of sensory‐induced gamma oscillations in the thalamus.

A, schema of the experimental protocol. Recordings were made in topographically aligned thalamic and cortical recording sites while stimulating the principal whisker using a piezo‐electric device. The trace represents a cutout of the onset of a vibrotactile stimulus waveform at 200 Hz, as measured with photodiodes. B, example of single‐trial evoked responses of topographically aligned thalamic and cortical recording sites. Horizontal bar indicates stimulus presentation. Lower traces correspond to an expended portion of the upper traces. C, red traces correspond to the averaged power spectra for one cortical recording site, computed between 50 and 950 ms after the onset of the stimulus presentation. Black traces correspond to the power spectra computed in a topographically aligned thalamic site recorded simultaneously with the cortical one. Shaded regions indicate the 95% error bars estimated with a jackknife across tapers and trials. Asterisk indicates stimulation frequency; curved arrow indicates emergent gamma power. D, red traces correspond to the averaged spike–field coherence for the cortical recording site, computed between 50 and 950 ms after the onset of stimulus presentation. Black traces correspond to the power spectra computed in a topographically aligned thalamic site recorded simultaneously with the cortical one. Shaded regions indicate the 95% error bars estimated with a jackknife across tapers and trials. Asterisk indicates stimulation frequency; curved arrow indicates emergent gamma power. E, average coherence of the spiking and cortical field potential activity across time for the cortical recording site (left) and the thalamic recording site (right). Time is on the x‐axis; frequency is on the y‐axis. Coherence is colour‐coded on a linear scale. Horizontal bars indicate stimulus presentation.
