
Figure 5.
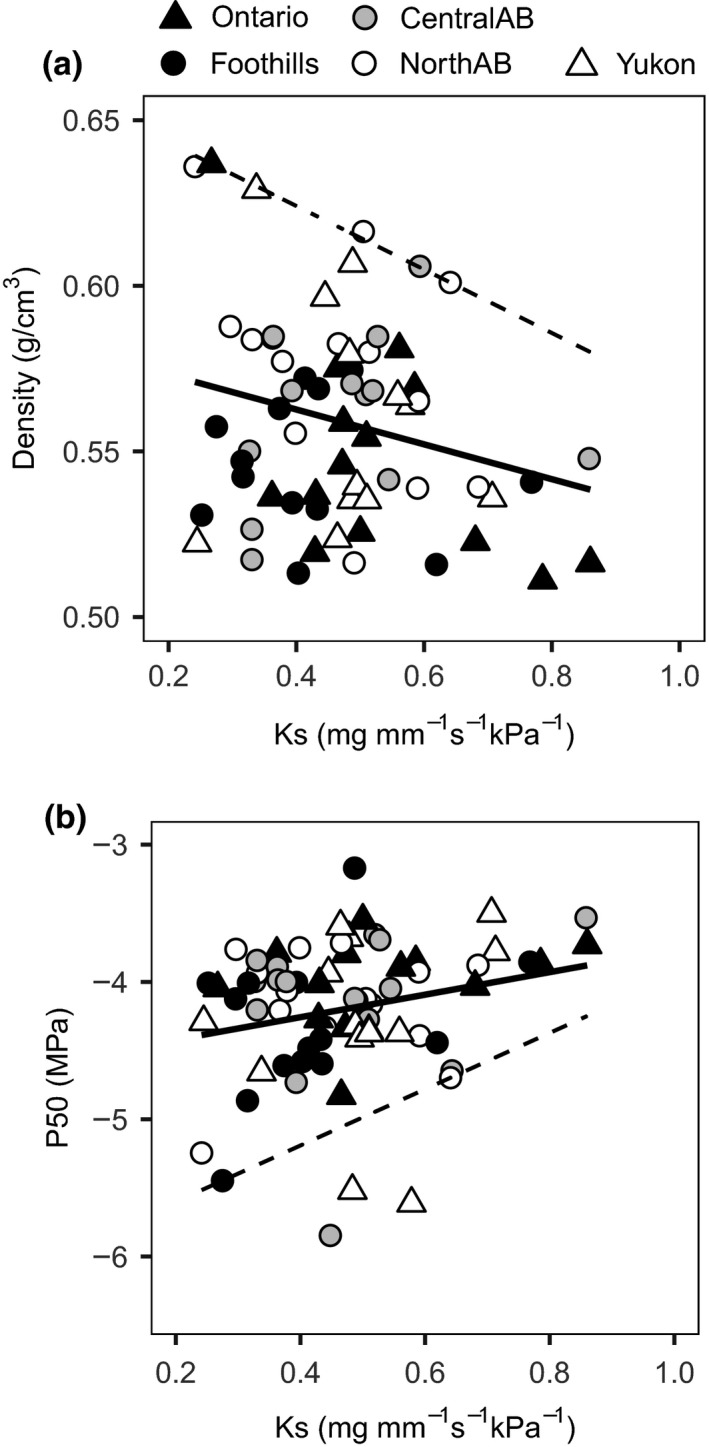
Relationship of individual values of xylem‐specific conductivity (KS) and (a) wood density (R 2 = .077, p = .013) and (b) vulnerability to cavitation expressed as P50, the xylem pressure inducing 50% loss of hydraulic conductivity (R 2 = .048, p = .042). The dashed lines represent the 95% (a) and 5% (b) quantile regression lines to illustrate the scarcity/absence of data points in the upper‐right (a) and lower‐right (b) corners