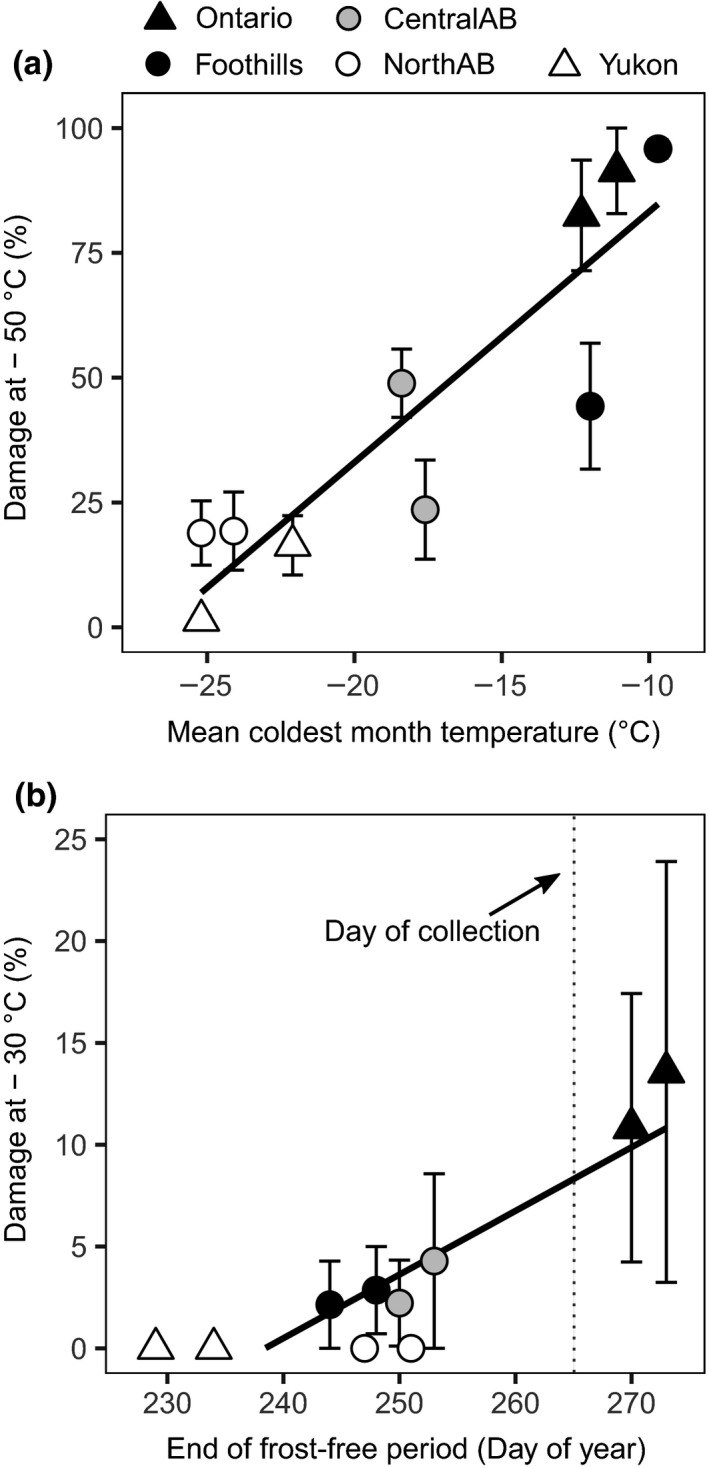
Figure 7.

Relationship between cold hardiness (on the y‐axis) and source climate (on the x‐axis). (a) Cold damage at −50°C showed a high correlation to the mean coldest month temperature (R 2 = .784, p < .001). (b) Cold damage at −30°C as a function of the average day of the year when the first frost event occurs. Samples were collected on day 265 (22 September, dashed line). Only Ontario provenances (closed triangles) showed damage significantly greater than 0, consistent with the absence of frost at their native environment at that time of year. Error bars correspond to one standard error
