. 2017 Dec 31;33(4):298–307. doi: 10.5625/lar.2017.33.4.298

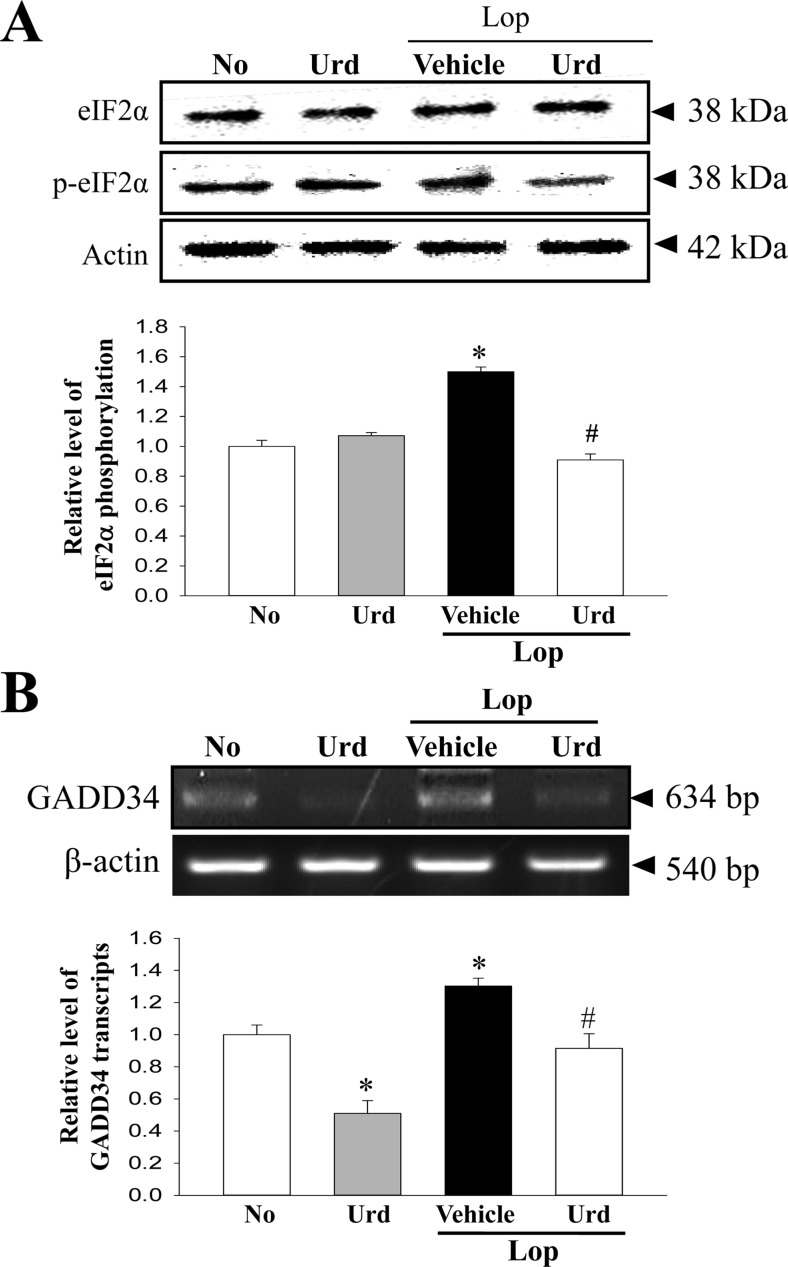
Figure 3. Expression of marker proteins in the PERK/eIF2-ATF4 pathway. (A) The expression levels of eIF2α and p-eIF2α in total proteins were detected with specific antibodies. The level of β-actin is also shown as an endogenous control. The band intensity of these proteins was determined using an imaging densitometer, and the relative levels of each protein were calculated based on the intensity of actin protein as an endogenous control. (B) The levels of GADD34 transcripts in total mRNA of transverse colons were measured by RT-PCR using specific primers. After the intensity of each band was determined using an imaging densitometer, the relative levels of GADD34 transcripts were calculated based on the intensity of actin transcripts. Data represent the means±SD from three replicates. *P<0.05 compared to the No treated group. #P<0.05 compared to the Lop+Vehicle treated group.

Figure 3