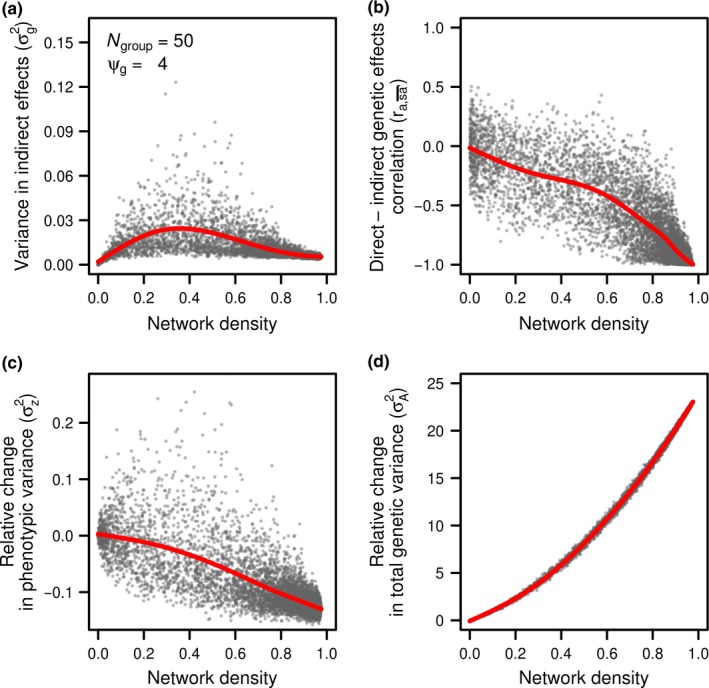
Figure 3.

Effects of network density on (a) the variance in indirect effects experienced by individuals, (b) the correlation between direct and indirect genetic effects experienced by individuals, (c) the change in phenotypic variance within groups relative to the genetic variance (i.e., the phenotypic variance in absence of interactions), and (d) the change in total genetic variation relative to the genetic variance (i.e., variance of individual direct genetic effects and indirect genetic effects imposed to others). Each dot represents a simulated network, or group of 50 individuals (N group = 50). Indirect genetic effects were generated using a ψg of 4
