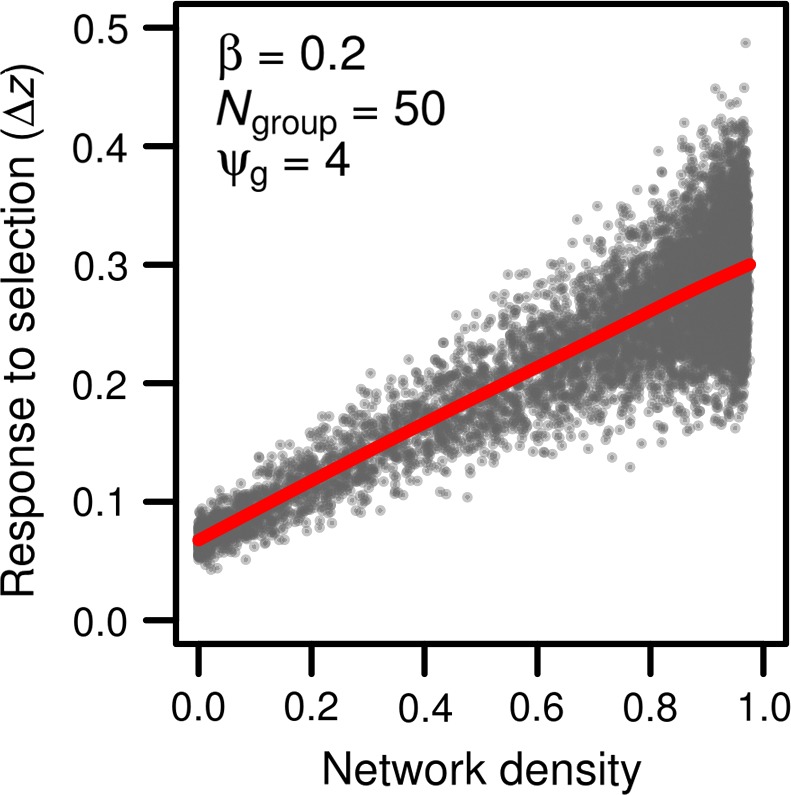
Figure 4.

Evolutionary response of phenotype to a selection gradient varies with network density. The average change in phenotype mean resulting from selection increased with network density (red line). Groups with denser networks of interactions exhibited more variation in the change in phenotypic mean (gray dots). Each dot represents a simulated network, or group of 50 individuals (N group = 50). Indirect genetic effects were generated using a ψg of 4
