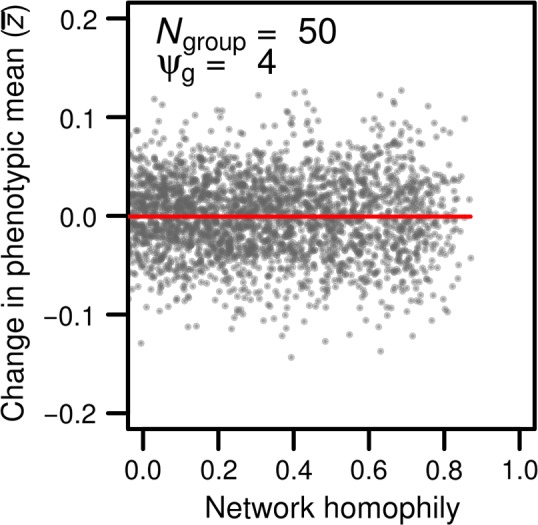
Figure 5.

The average phenotype of individuals as a function of network homophily (red line). Each dot represents a simulated network, or group of 50 individuals (N group = 50). Indirect genetic effects were generated using a ψg of 4. Networks could not reach homophily values of 1 because we used a continuous trait value rather than discrete values (see Farine, 2014)
