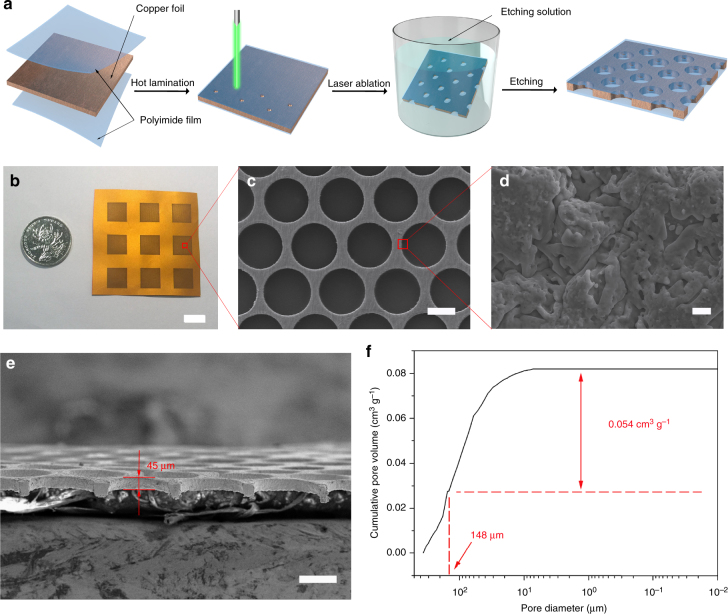
Fig. 1.
Preparation and characterization of E-Cu. a Schematic of the fabrication process of E-Cu. b Photograph of the as-obtained E-Cu current collector. c Typical SEM overview image of E-Cu after peeling off the coated PI films. d Magnified SEM image of the edge of the copper scaffold from c. Scale bars in b–d are 1 cm, 100 μm and 1 μm, respectively. e Typical cross-sectional SEM image of E-Cu after peeling off the surface PI films. Scale bar in e is 100 μm. f Cumulative pore volume of E-Cu by mercury porosimetry. Herein, the diameter of interior compartments is controlled to be ~150 μm, which was in accordance to the porosity analysis result (148 μm), as marked in red colour in f. The weight of E-Cu tested here was 0.3141 g and the total surface area for all the compartments was 9 cm2; thus, the effective pore volume of E-Cu is 1.88 × 10⁻³ cm3 cm−2

