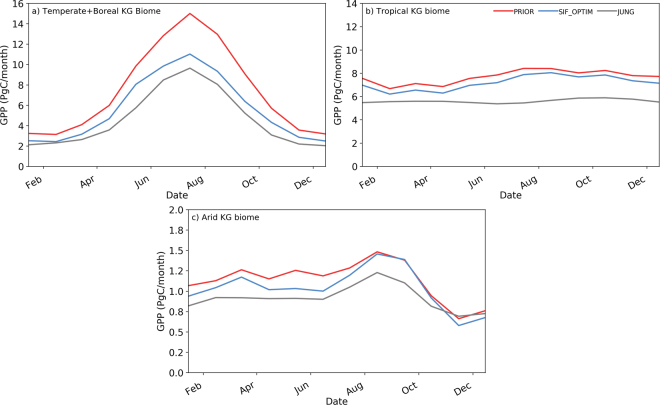
Figure 3.
Mean monthly GPP seasonal cycle over 2007–2011 period (PgC/month) for: (a) temperate and boreal Köppen-Geiger (KG) biomes (approximately equivalent to northern hemisphere >60°N); (b) tropical KG biomes (approximately equivalent to tropical latitudes 30°S to 30°N); (c) arid KG biomes. The prior simulation is shown in the red curve, and the posterior in blue. The grey curve shows a comparison with the JUNG up-scaled FLUXNET data-driven GPP product by Jung M. et al.18. Köppen-Geiger classification based on Peel M. C. et al.53.

