
Figure 3.
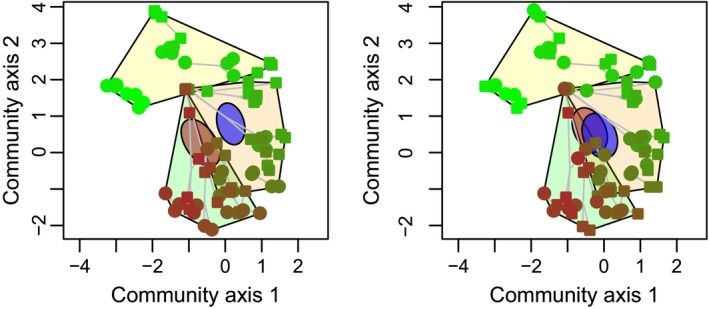
Compositional changes in historic communities explained by expected and unexpected laboratory biases, and biological signal. Points represent communities reconstructed from replicated DNA extractions from 21 sediment horizons, representing the last ~70 years of the lake's history. Symbol color indicates age: Dark brown is the oldest, and light green is the youngest communities. Replicated DNA extracts of a horizon are connected by gray lines. The operational phases of the nuclear power plant are marked with hulls: green—before building the plant, orange—during power plant operation, and yellow—after operation. (a) Symbols mark the effects of laboratory personnel on community composition, and the two ellipses show the 95% confidence interval of the corresponding group centroids. (b) Symbols and ellipses mark the effects of the DNA extraction kits