Figure 2.
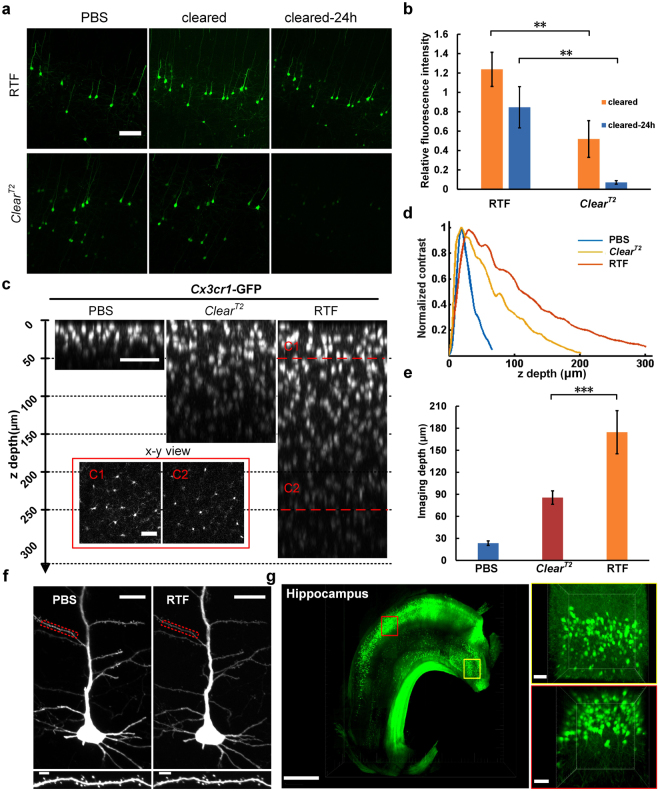
Preservation of GFP fluorescence and morphology maintanence. (a) Thy1-GFP-M line adult brain slices (1-mm-thick) were prepared and imaged before and after clearing with RTF and ClearT2. Maximum intensity projections of representative images were shown. Scale bar, 100 μm. (b) Quantifications of fluorescence intensity for GFP. The relative total fluorescence intensity after RTF clearing showed significantly higher value than ClearT2. Data are presented as mean ± s.d (n = 5). **P < 0.01 (Mann-Whitney U test). (c) Orthogonal view (x-z) of image stacks obtained from Cx3cr1-GFP mouse brain slices (1-mm-thick). Scale bar, 50 μm. The insets were the optical slices (x-y view) indicated with dashed red line in C. (d) Represented curves of image contrast against z depth. (e) Bar plot of imaging depth calculated based on contrast decay for PBS, ClearT2 and RTF. Data are presented as mean ± s.d (n = 4). ***P < 0.001 (One-way ANOVA followed by Dunnett’s post hoc test). (f) Typical pyramidal neurons imaged before and after clearing. Scale bar, 20 μm in top, 5 μm in bottom. (g) Reconstruction of neurons in hippocampus of Thy1-GFP-M mouse. Scale bar, 1000 μm in left, 50 μm in right.

