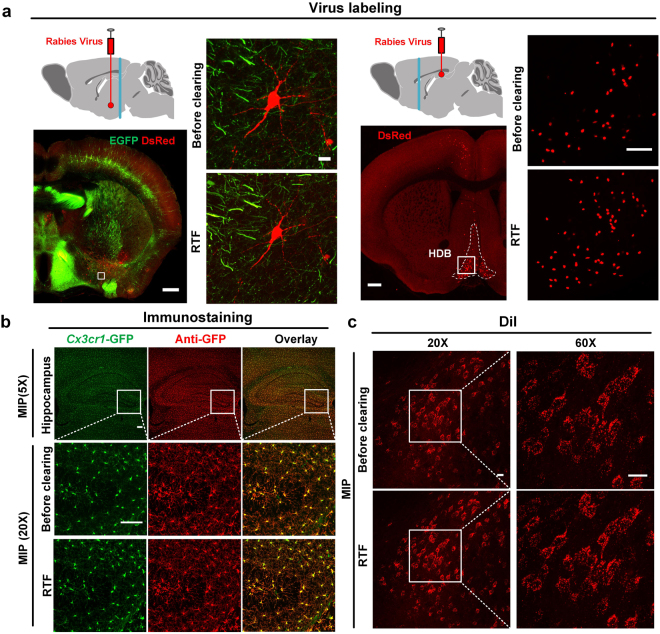
Figure 3.
Compatibility of RTF with virus labeling, immunostaining and DiI-labeling. (a) The injection site of rabies virus (red point) and position of brain section (cyan line) are shown in the schematic diagram. This diagram was drawn by referring to The Mouse Brain in Stereotaxic Coordinates, 2nd edition, Franklin, K.B.J. and Paxinos, G. After transducing with RV-ΔG-dsRed, the brain sections at indicated positions were dissected and imaged before and after clearing with RTF. The maximum intensity projections of enlarged region are indicated with white box in the image of half brain section. DsRed in red and EGFP in green. The images showed that endogenous GFP and virally delivered dsRed expression both presented fine fluorescent signal. Scale bar, 500 μm for first and third panel; 50 μm for second panel; 100 μm for fourth panel. (b) Cx3cr1-GFP hippocampus sections immunolabeled with microglial cells marker anti-GFP, cleared with RTF; The GFP and anti-GFP fluorescence (with a secondary antibody conjugated to Alexa Fluor 594) were visualized. Scale bar, 100 μm. (c) Merged stack of DiI-labeled cells in MD region imaged from 400 μm brain section, before and after clearing. Scale bar, 20 μm.

