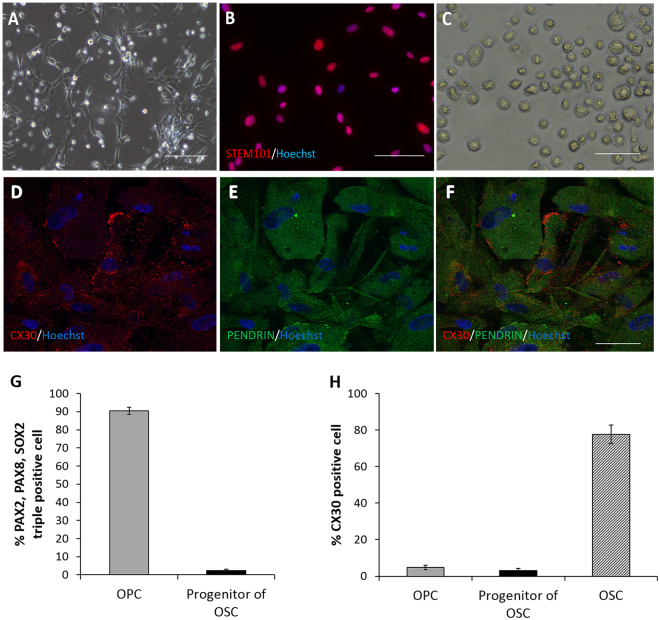
Figure 2.
(A) The image shows adhesive progenitors of OSCs in culture. The bar indicates 50 μm. (B) The image shows the reactivity of progenitors of OSCs with STEM101 in the nuclei. STEM101 (red) and Hoechst (blue) are co-expressed in all cells. The bar indicates 50 μm. (C) The image shows progenitors of OSCs dissociated into single cells with trypsin. The size of the cells is 10–25 μm. The bar indicates 50 μm. (D) Image of OSCs immunostained with CX30 (red). Nuclei were counterstained with Hoechst (blue). (E) Image of OSCs immunostained with PENDRIN (green). Nuclei were counterstained with Hoechst (blue). (F) Merged image of (D) and (E). Red: CX30; Green: PENDRIN; Blue: nuclei. Scale bars indicate 50 μm. (G) The graph shows percentages of cells positive for otic markers (PAX2, PAX8, and SOX2) among OPCs and progenitors of OSCs in vitro. (H) The graph shows percentages of CX30-positive cells in OPCs, progenitors of OSCs, and OSCs in vitro.

