Figure 3.

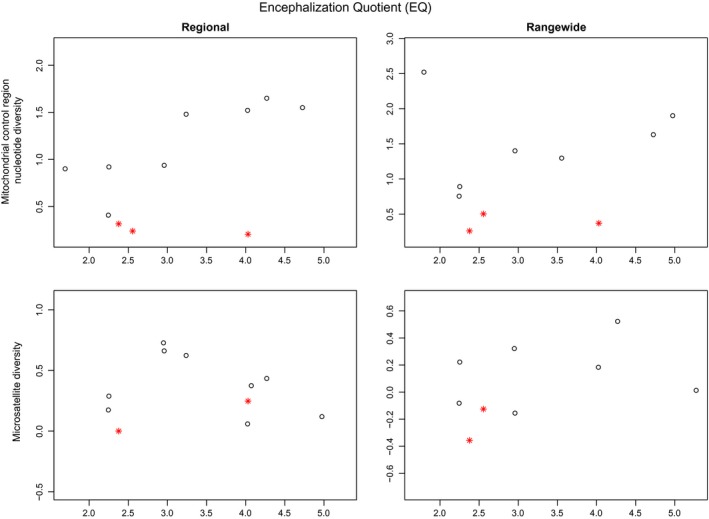
Mitochondrial and relative nuclear genetic diversity of cetacean species plotted against encephalization quotient (EQ 0.67) for both “Regional” and “Rangewide” datasets. Matrilineal species are designated by a red star

Mitochondrial and relative nuclear genetic diversity of cetacean species plotted against encephalization quotient (EQ 0.67) for both “Regional” and “Rangewide” datasets. Matrilineal species are designated by a red star