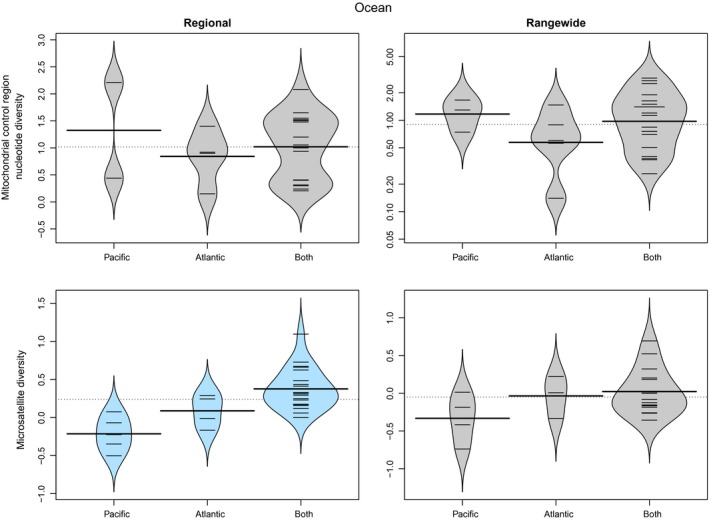
Figure 5.

Beanplot of mitochondrial and relative nuclear genetic diversity of cetacean species according to their distribution in either or both of the Pacific and Atlantic Oceans for both “Regional” and “Rangewide” datasets. Significant results (α = 0.05) are colored in blue
