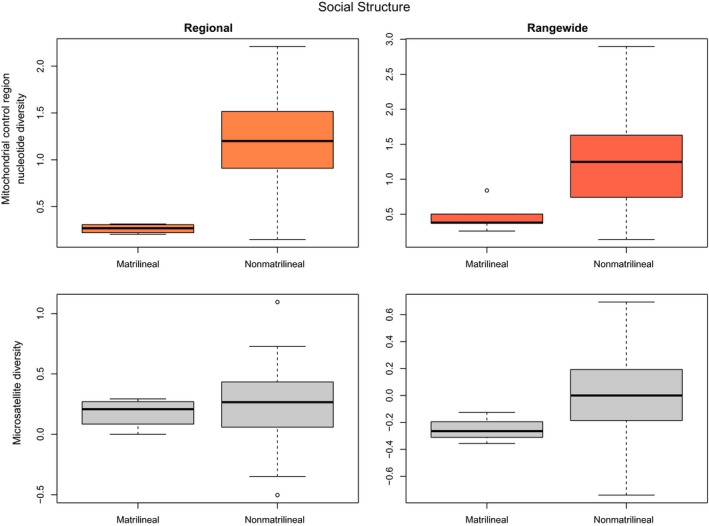
Figure 7.

Boxplots of mitochondrial and relative nuclear genetic diversity of cetacean species according to their social structure—whether they possess a matrilineal social system or not, for both “Regional” and “Rangewide” datasets. Significant results (α = 0.05) are colored in orange
