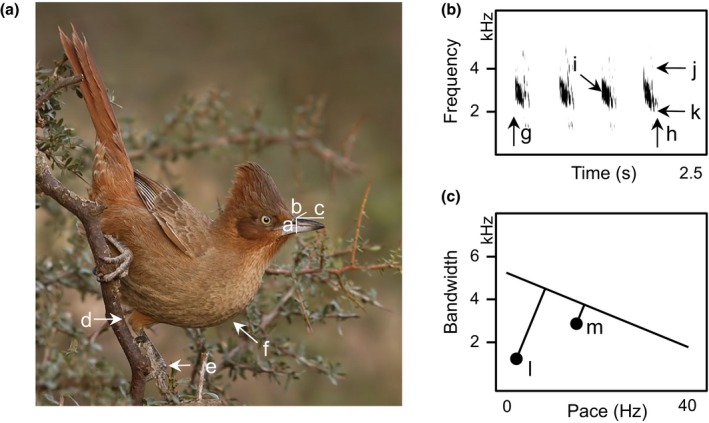
Figure 1.

Phenotypic traits of ovenbirds. Exemplar data used in this study, illustrated for a single species (Brown cacholote, Pseudoseisura lophotes). (A) Morphological measurements collected from museum specimens, including beak depth (a), width (b) and length (c), tarsus length (d to e), and body mass (f). (B) Spectrogram of song segment indicating acoustic traits measured, including duration (g–h), pace (song duration/number of notes), peak frequency (i), maximum frequency (j), minimum frequency (k), and frequency bandwidth (j–k). (C) Frequency bandwidth plotted as a function of pace with the upper‐bound regression for the Furnariidae (y = −79.374x + 5066.2) and the orthogonal distance (vocal deviation) for a song of P. lophotes (l), which has comparatively lower vocal performance than song of many other ovenbird species, for example, Schizoeaca fuliginosa (m). Photograph by Mario Fiorucci; song file downloaded from www.xeno-canto.org (XC151258)
