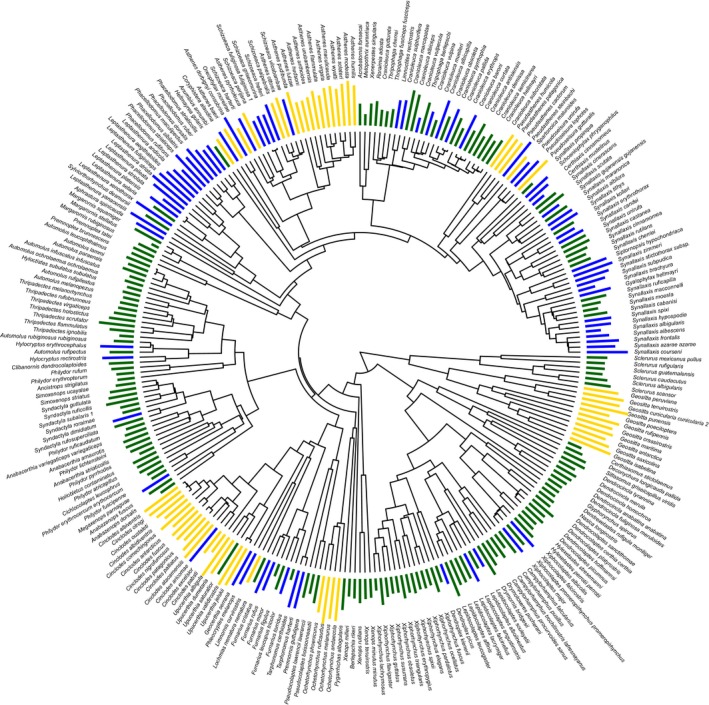
Figure 2.

Phylogenetic hypothesis and habitat preferences for the ovenbird radiation. Colored bars show two different types of habitat data associated with tree tips. Height of bars indicates value of Environmental PC1 extracted from geographical range polygons; color‐coding of bars reflects habitat type categories generated from the literature (closed habitats = green; semi‐open habitats = blue; open habitats = yellow)
