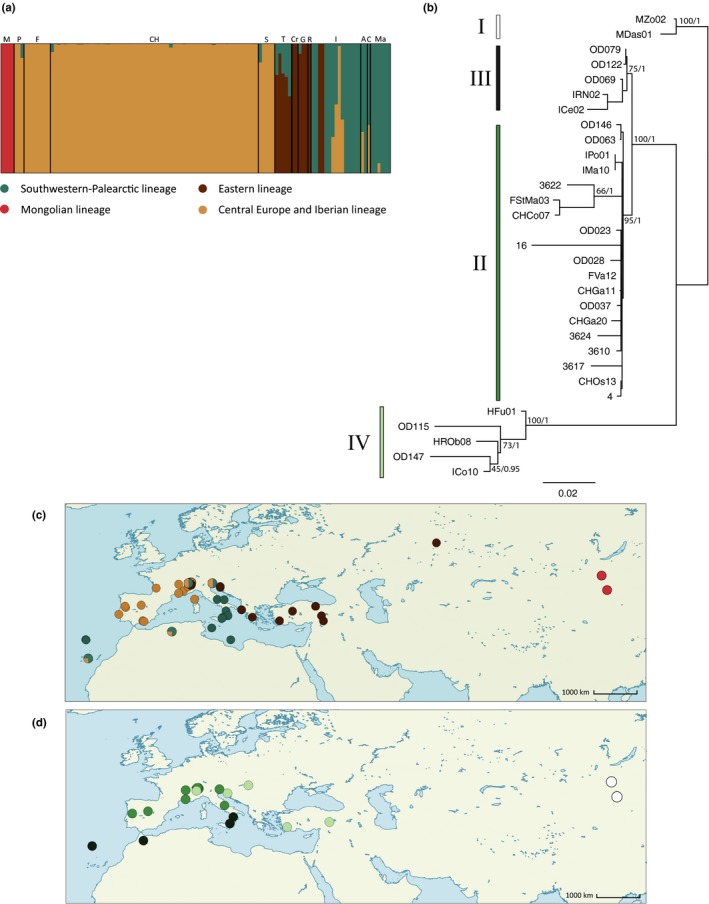
Figure 1.

(a) Individual Bayesian cluster analysis of hyRAD SNP data using fastSTRUCTURE (Raj et al., 2014) based on 1,165 SNPs and assuming four genetic clusters; the letters stand for the populations of origin of each sample. M: Mongolia (corresponding to Oedaleus decorus asiaticus samples); P: Portugal; F: France; CH: Switzerland; S: Spain; T: Turkey; Cr: Croatia; G: Greece; R: Russia; I: Italy; A: Algeria; C: Canary Islands; Ma: Madeira. (b) Maximum‐likelihood phylogenetic tree obtained with PhyML (Guindon & Gascuel, 2003) based on a reduced panel of 31 samples using 9,892‐bp‐long mtDNA sequences. Bootstrap support values for the phylogeny generated using 1,000 resampled datasets and aBayes nodes support are, respectively, indicated in first and second positions next to the major nodes. Roman numerals stand for the four main phylogenetic clades. (c) Spatial representation of the SNP‐based genetic structure illustrated in (a), with the proportion of each population assigned to each cluster shown with different colors as a pie chart. (d) Spatial representation of the four mtDNA clades shown in (b)
