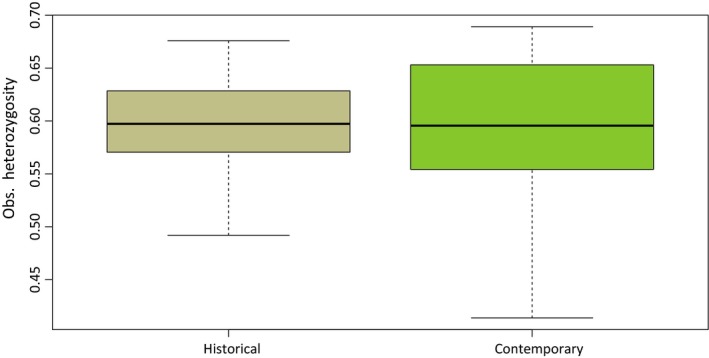
Figure 2.

Distribution of observed heterozygosity at the individual level from historical (i.e., before 1955; n = 29) and contemporary (n = 33) Swiss samples. Top and bottom of the box, respectively, represent the upper and the lower quartile, and the bold line corresponds to the median (both groups are not significantly different in terms of observed heterozygosity; W = 467.5, p = .88)
