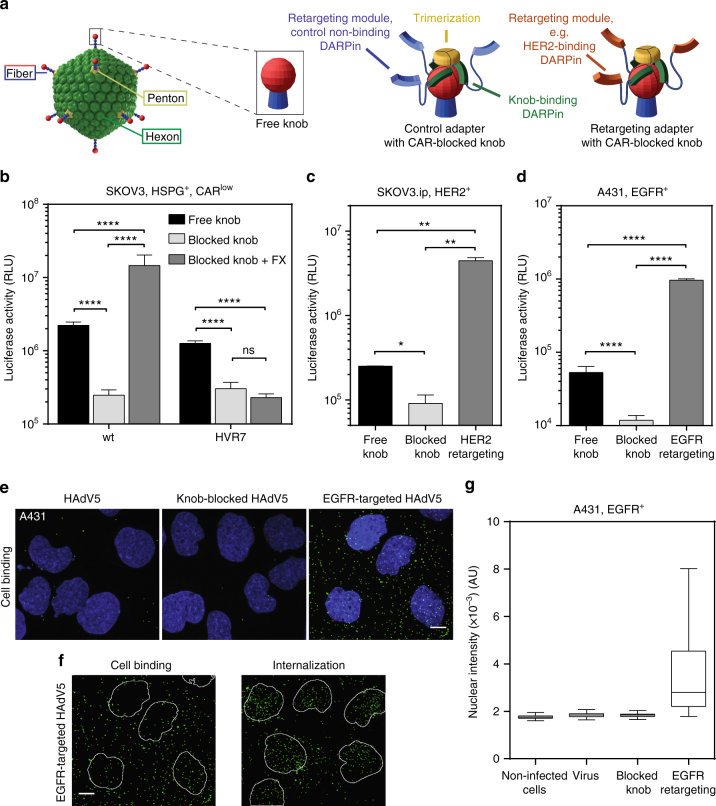
Fig. 1.
Retargeting of FX-binding-ablated HAdV5HVR7 to HER2+ and EGFR+ tumor cells. a Overview of the knob-adapter complexes. Knob-binding DARPins are trimerized through SHP and bind the knob in a quasi-covalent manner34. The retargeting module (orange), a target-specific DARPin, allows binding of tumor biomarkers like HER2 or EGFR. Non-targeting (control) DARPins are shown in blue. b Hexon-engineered HAdV5HVR7 infects CAR-expressing SKOV3 cells with similar efficiency as the wt virus, but addition of FX boosted only wt transduction, since HAdV5HVR7does not bind FX. RLU, relative light units; HSPG, heparan sulfate proteoglycan. c, d Knob binding of adapter decreased HAdV5HVR7 viral gene delivery to tumor cells in both c SKOV3.ip and d A431 cells through blocking of CAR interaction. Fusion of a HER2- or EGFR-binding DARPin to the adapter resulted in a ×50, or ×80 increase of tumor cell transduction, respectively. Shown are sample means ± SD from biological replicates ((b) n=4; (c) n = 2; (d) n = 4), two-way ANOVA of log-transformed data, *P < 0.05, **P < 0.01, ****P < 0.0001. e, f Analysis of binding and internalization of Alexa-Fluor 488-labeled HAdV5wt to A431 cells. Viruses were bound to cells at +4 °C for 1 h and were fixed immediately or after subsequent 1 h of incubation at 37 °C. Images shown represent maximum projections of individual confocal stacks. Nuclei (DAPI stain) are blue and virus particles green. e The EGFR-retargeted virus showed increased cell binding in comparison to wt or fiber knob-blocked viruses and bind all over the cell. Pictures from the confocal microscopy are maximal projections of the cells, not slices through one plane, as explained in further detail in Supplementary Fig. 1. Scale bar = 10 µm. f At 4 °C (left), cell binding occurs, while at 37 °C internalization of EGFR-mediated HAdV5wt results in nuclear trafficking of the particles. Nuclei are shown as outlines. Scale bar = 10 µm. g Retargeting of fiber-blocked virus to EGFR increases transduction of A431 tumor cells. A431 cells were imaged by automated fluorescence microscopy. The mean GFP intensity over a DAPI mask was quantified in single cells. In the box-and-whisker plots, center lines show the mean; box limits the 25th and 75th percentiles; whiskers according to Tukey. For each condition between 4 and 9 × 10³ cells were analyzed. AU, arbitrary units

