Fig. 1.
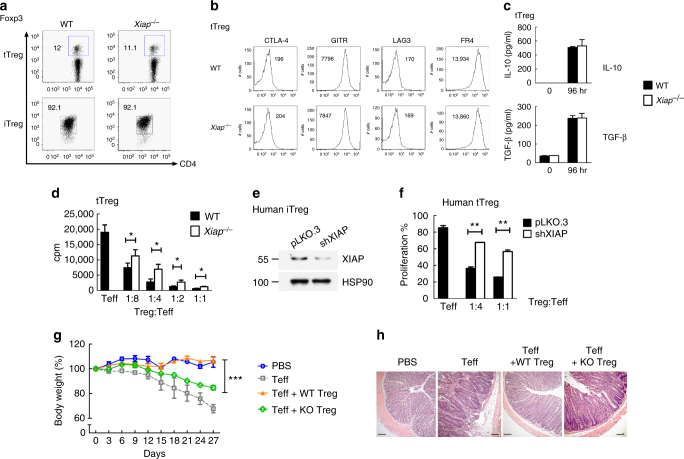
XIAP-deficiency impairs Treg cell suppressive function. a Comparable control and Xiap−/− tTreg cells and iTreg cells development. The fractions of splenic CD4+Foxp3+ population from control (WT) and Xiap−/− mice were determined (tTreg). WT and Xiap−/− CD4+CD25− T cells were treated with anti-CD3/CD28 plus TGF-β and IL-2, and Foxp3 expression at day 5 was assessed (iTreg). Experiments were independently repeated six times. b XIAP-deficiency does not affect the Treg cells phenotype. Expressions of CTLA-4, GITR, LAG3 and FR4 in WT and Xiap−/− tTreg cells were determined. Numbers indicate mean fluorescence intensities. c Normal IL-10 and TGF-β production in Xiap−/− tTreg cells. CD4+CD25+ cells were stimulated with anti-CD3/CD28 and IL-2 for 96 h, before generation of IL-10 and TGF-β was determined. d Impaired in vitro suppressive activity of Xiap−/− tTreg cells. CD4+CD25- cells were incubated with anti-CD3, antigen-presenting cells, and the indicated ratios of WT and Xiap−/− CD4+CD25+ tTreg cells. [3H]thymidine incorporation was determined at 80 h. Values are mean ± SD of triplicate samples in an experiment. *P < 0.05, **P < 0.01 for unpaired t-test. Experiments were reproduced independently three times with similar outcomes. e Knockdown of XIAP in human Treg cells. The levels of XIAP in control (pLKO.3) and XIAP-knockdown human iTreg cells were determined by immunoblots. f Impaired suppressive activity in XIAP-deficient human tTreg cells. Human effector T cells (Teff) were labeled with 2 μM CFSE, activated by anti-CD3/CD28 in the presence of the indicated ratio of human control and XIAP-knockdown tTreg cells, and collected at 72 h. Proliferation was determined by gating CD4+ T cells for their CFSE intensity in flow cytometry. g, h Diminished inhibitory activity of Xiap−/− tTreg cells in vivo. CD4+CD25− effector T cells were administered intraperitoneally into Rag1−/− mice with WT or Xiap−/− tTreg cells. Body weight was determined at the indicated time-points (g). Data are the mean ± SD of six mice in each group. ***P < 0.001 for two-way ANOVA. Mice were killed at day 27 and colons were removed, fixed in paraformaldehyde, sectioned, and stained with H&E. Micrographs are representative of the six mice in each group. Bar indicates 100 μm

