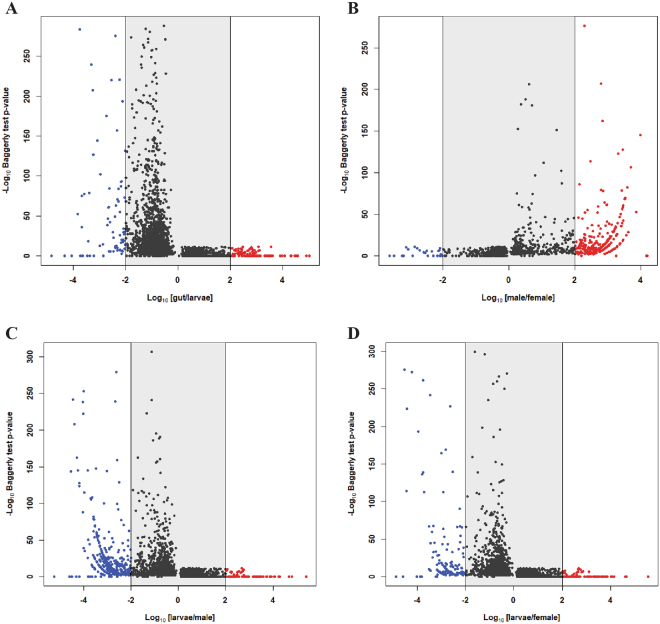
Figure 3.
Volcano plots showing statistically significant gene expression differences after Bonferroni correction in Leptinotarsa decemlineata. (A) Mid -gut tissue versus whole larvae, (B) an adult male versus an adult female, (C) an adult male versus whole larvae, and (D) an adult female versus whole larvae. Points outside the gray area indicate >100-fold-differences in expression. Blue points indicate down-regulated genes and red points indicate up-regulated genes in each contrast.

