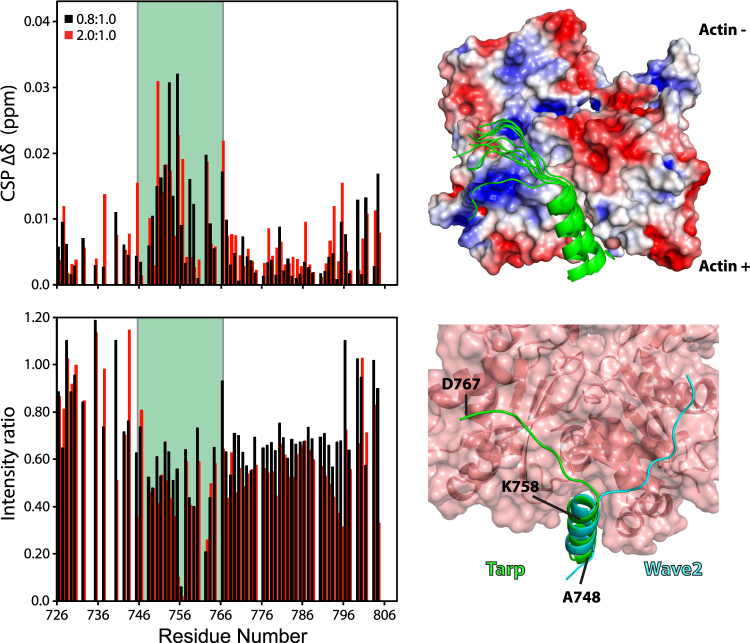
Figure 5.
Binding of Tarp to actin. Left: The chemical shift perturbations (∆δ) (top) and relative peak intensity changes (bottom) observed between [1H-15N]-HSQC spectra of free Tarp726–825 and those containing 0.8:1 (black) and 2:1 (red) approximate molar ratios of G-actin. The residues highlighted within the green strip indicate the WH2-homologous Tarp region (residues 746–767) used for the Rosetta based FlexPepDock modeling26,27. Top right: The 10 lowest energy complex models of the docked Tarp WH2 region (green) with actin using the FlexPepDock webserver. The actin surface was coloured by electrostatic charge (−3 (red) to +3 kT.e−1 (blue)) using the APBS plugin56 for PyMOL (The PyMOL Molecular Graphics System, Version 1.8.2 Schrödinger, LLC). Bottom right: The lowest energy docked Tarp:actin complex, with labeled residues, compared to the WAVE2 (pdb code: 2A40) structure (cyan) with a red transparent actin surface.

