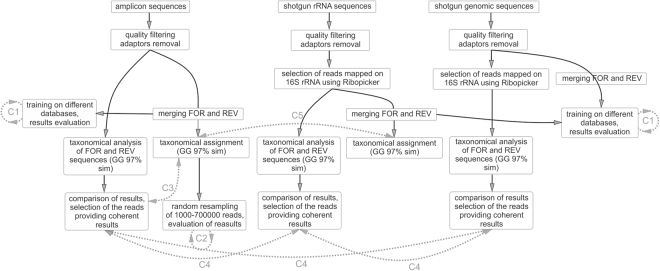
Figure 1.
Outline of data analysis process. Gray boxes and black arrows represent the analysis workflow, gray dotted lines represent comparisons between different approaches used for data analysis. (C1) Influence of the database used to train the Bayesian classifier; (C2) influence of the number of reads on taxonomic results; (C3) influence of paired-end reads merging on the taxonomy; (C4) comparison between different 16S rRNA sequencing approaches (with independent taxonomic analysis of forward and reverse paired-ends); (C5) comparison between different 16S rRNA sequencing approaches (using merged paired-ends).

