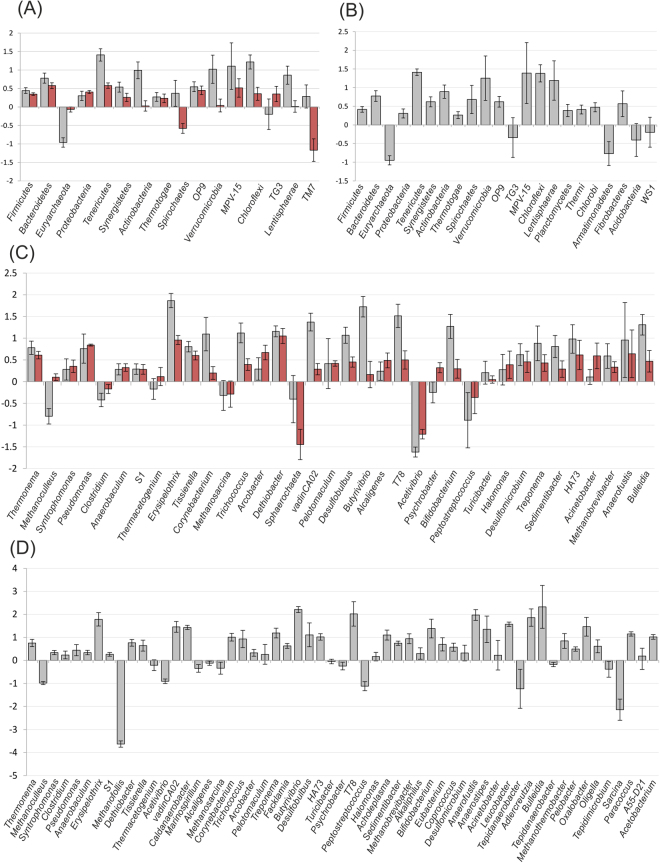
Figure 4.
Comparison between abundance of different taxa determined using three sequencing approaches. Results are reported as average of the results determined in the six samples examined (CSTR01a-03a; CSTR01b-03b). The log2 ratios of the abundances calculated comparing two different approaches are reported in y axes. Grey bars represent comparison between amplicon sequencing and shotgun RNA, red bars represent the comparison between amplicon sequencing and shotgun DNA. Taxa having higher abundance in amplicons in comparison to shotgun RNA sequencing are reported as gray bars with positive values, those having higher values in amplicons in comparison to shotgun DNA are reported as red bars with positive values. (A) Comparison at phylum level between amplicons, shotgun RNA and shotgun DNA (for and rev sequences analyzed separately); (B) comparison at phylum level between amplicons and shotgun RNA; (C) the same comparison reported in (A) at genus level; (D) the same as reported in (B) at genus level. In (B) and (D) analysis was performed on 700,000 sequences obtained after merging for and rev paired-ends.

