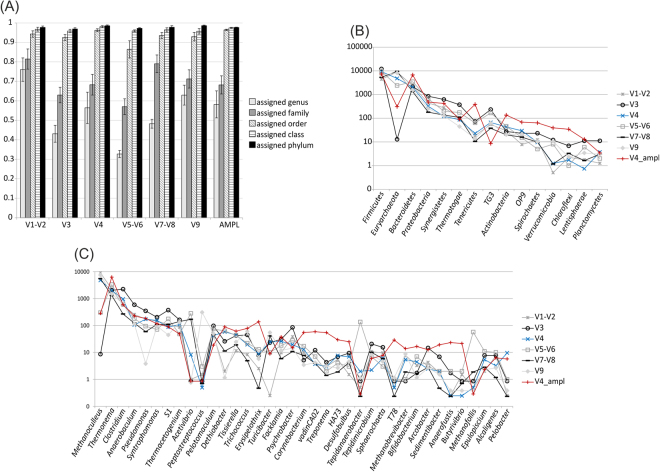
Figure 5.
Abundance of different taxa calculated considering shotgun rRNA sequences assigned to different hypervariable regions. (A) Fraction of sequences assigned to different taxonomic levels and normalized considering the total number of sequences assigned to each hypervariable region. Number of reads assigned to different phyla (B) and genera (C) calculated considering reads assigned to different hypervariable regions. Notice the logarithmic scale on y axes (number of sequences) in (B) and (C). In (A) all the six samples are reported and variability is represented as standard deviation on each bar, in (C) results are reported for sample CSTR01a.

