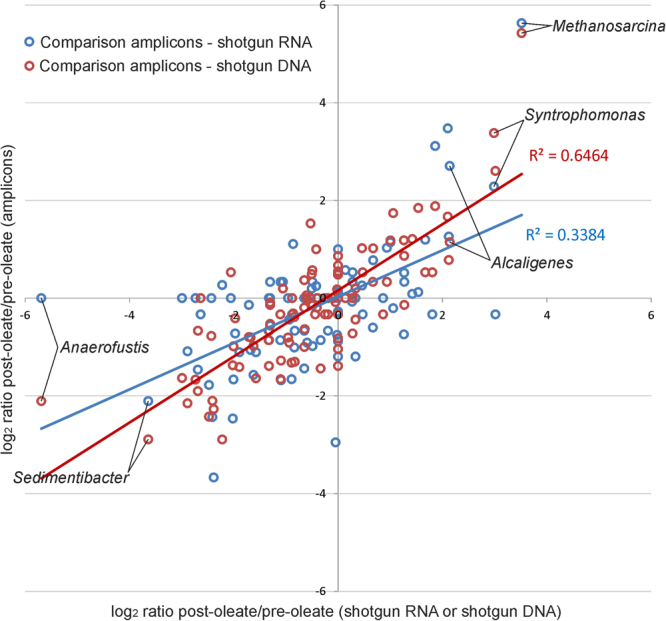
Figure 6.

Abundance ratio (log2) determined for the 100 most abundant genera before and after Na-oleate addition. x and y axes report the log2 ratios obtained by dividing abundance level of genera “after” and “before Na-oleate” addition. “Blue dots” represent the comparison between log2 ratio determined for amplicon sequencing (x-axes) and log2 ratio determined for shotgun RNA sequencing (y-axes) (60,000 subsampled sequences). “Red dots” represent the comparison between the log2 ratio determined for amplicon sequencing (x-axes) and log2 ratio determined for shotgun DNA sequencing (y-axes).
