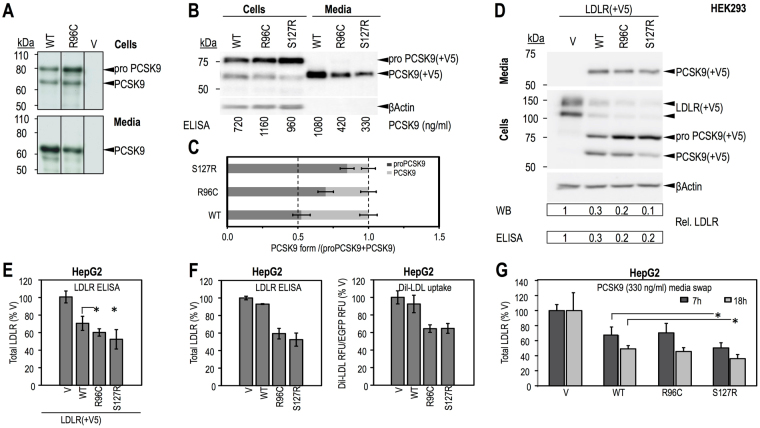
Figure 2.
Cell-based functional characterization of PCSK9 wild-type (WT) and p.Arg96Cys (R96C). HEK293 cells were transiently transfected with V5-tagged PCSK9-WT (WT), PCSK9-R96C (R96C) or empty vector (V) (A), or gain of function PCSK9-S127R (S127R) (positive control) (B and C) and analyzed for PCSK9 cellular expression, zymogen processing and secretion of mature protein. (A) Biosynthetic analysis; 48 h post-transfection cells were pulsed-labeled with [35S]Met/Cys for 3 h, followed by anti-V5 immunoprecipitation, SDS-PAGE and autoradiography. (B) WB analysis using anti V5-HRP. Levels of total cellular and secreted PCSK9 were quantified by ELISA and the concentrations are listed. The bands corresponding to proPCSK9 and PCSK9 in (B) were quantified, their values normalized to β−Actin and ratios of the value of each form to the sum of the two forms were graphed in (C). V5-tagged LDLR was co-transfected with V5-tagged PCSK9-WT, PCSK9-R96C, PCSK9-S127R or empty vector, as control, in HEK293 cells (D) or HepG2 cells (E). Transfected HEK293 cells were analyzed by WB using anti V5-HRP (D). Total cellular levels of LDLR were quantified from the WB and by ELISA for HEK293 cells (D) or by ELISA only for HepG2 cells (E) and were normalized to values of the control. (F) HepG2 cells were transiently transfected with V5-tagged PCSK9-WT, PCSK9-R96C, PCSK9-S127R or empty vector, as control, and the total cellular endogenous levels of LDLR were quantified by ELISA (left). Dil-LDL uptake (right) was measured over 2 h. Measured values are reported as % control. (G) HepG2 cells were incubated for 7 h or 18 h with conditioned media from HEK293 cells (produced, illustrated and quantified in B): no PCSK9 control-media (V) or PCSK9-media (330 ng/ml), WT, R96C or S127R, and analyzed by ELISA for total cellular LDLR. Data are representative of two independent experiments performed at least in duplicate, with the exception of (F), where LDLR-ELISA was completed for one experiment performed in triplicate, while Dil-LDL uptake was measured in one experiment performed in 16 independent replicates per condition. Quantifications are averages ± SD. *p < 0.05; **p < 0.01; ***p < 0.001 (t-test). Full-length blots of Fig. 2A,B and D are presented in Supplementary Figure 2, where only the lanes selected in Fig. 2 are labeled.

